


Editor’s Note: Patient status and sub-status data reported by specialty pharmacies (SPs) is the primary source of information for this article. This is the first article in a series focused on how applying advanced data science techniques to patient access datasets can help manufacturers identify actionable insights and help patients start on therapy faster and stay on therapy longer.
Key Performance Indicators (KPIs) for specialty pharmacy products such as Time to First Fill and Fill Rate vary significantly across broad therapeutic areas. There’s also variability among different indications within those therapy areas largely driven by policy restrictions, competing therapies, and patient cost-sharing responsibilities. Figure 1 (below) illustrates this variance in key metrics across 4 broad categories — Immunology, Oncology, Respiratory and Neurology.
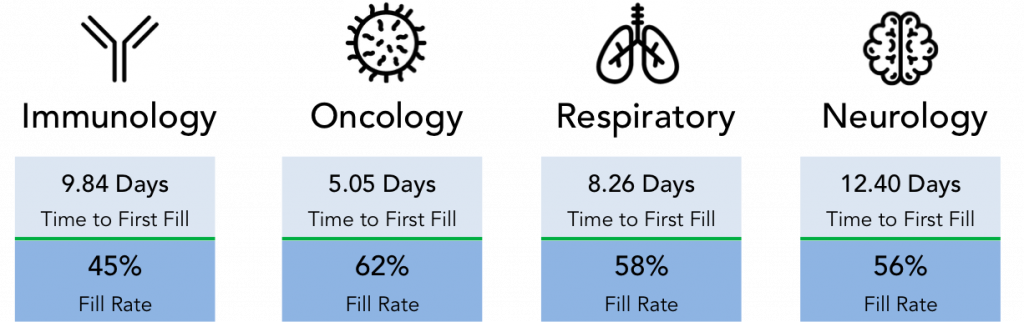
Figure 1: Variability in Time to First Fill and Fill Rate for a range of specialty therapeutic categories as reported in SP patient status data and calculated in IntegriChain’s ICyte platform for 2018 patients.
What’s happening with the patients who are prescribed specialty products but never start on therapy? Specialty pharmacies (SPs) sign data agreements to report this information to manufacturers as patient status and sub-status data. However, the quality of that data is often poor, provides limited visibility to patient access, and is not meaningful enough to create robust analytics without additional data cleansing and stewardship.
Sign Up for IntegriChain’s Specialty Pharmacy Data & Analytics Workshop
When a patient fails to initiate on therapy, that patient’s status is reported as CANCELLED. The patient sub-status gives the reported reason why the patient failed to initiate. Cancellation reasons are a rich source of information for your key stakeholders like SP Account, Field Reimbursement (FRM) and Patient Support teams. But as we observe in Figure 2 (below), the patient status information reported by SPs isn’t sufficient for your teams to take action and help stalled patients in all cases. Only 13% of CANCELLED cases were explicitly reported as Payer-driven by the SPs. There’s another 42% of cases where Payer policy restrictions like prior authorization (PA) could be delaying a patient’s therapy start date. Opportunities to intervene and help patients and providers navigate difficult PA processes are lost if the data does not accurately identify the barriers to initiation.
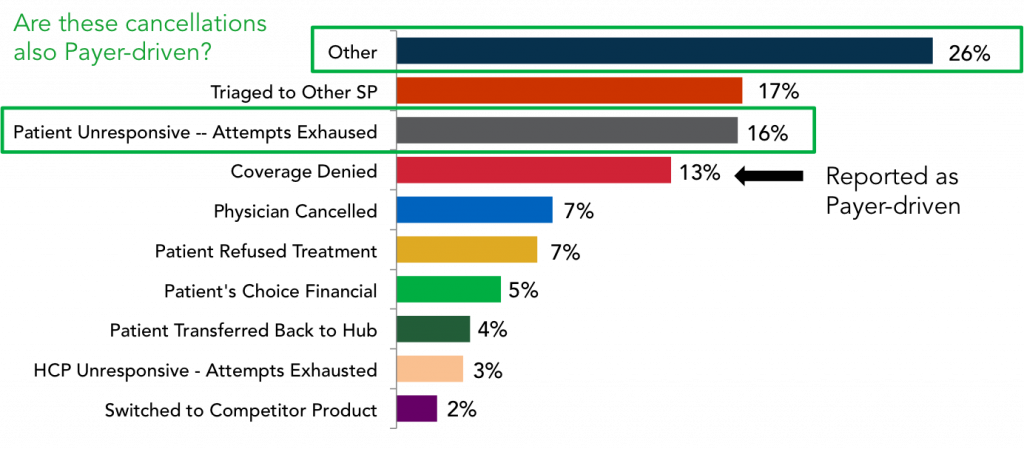
Figure 2: Patient status data reported by specialty pharmacies in IntegriChain’s ICyte platform only attributed 13% of Cancellations to Payer-driven reasons. A deeper analysis revised that percentage upward.
Analytics must go a level deeper to analyze the entire sequence of patient access steps to identify cases stalled due to barriers that your teams are able to overcome with a direct intervention. These cases are often referred to as ‘actionable’. In this example, an analysis is done at the individual patient level to determine where a patient was in the journey sequence prior to the Cancellation. Of the 42% of cases where the reported SP sub-status yielded little to no insight (see Figure 3 below), more than half were pending in PA or experienced a denial in the step prior to Cancellation. When the full patient access comes into view, Payer-driven Cancellations actually account for almost 40% of the overall Cancellations across the 4 broad therapeutic areas.
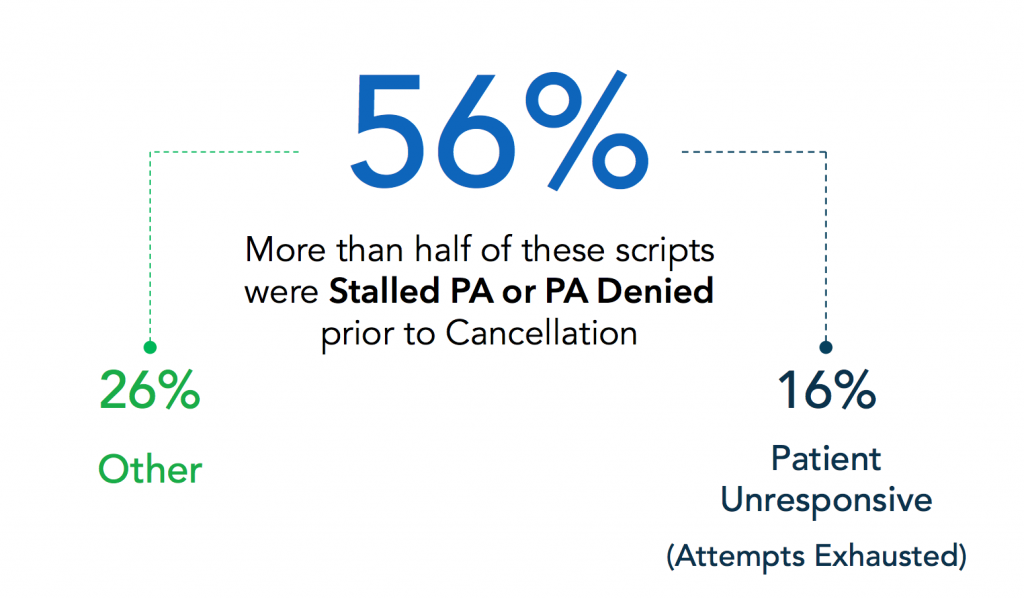
Figure 3: An analysis of Cancellation reasons where the SP sub-status data as reported by the network SP does not provide enough information for the manufacturer to take action on stalled patient cases.
Boosting Fill Rate through Targeted Reimbursement Support
The CANCELLED reasons an SP reports represent learning opportunities to intervene on behalf of patients and facilitate access to life-saving therapies. Our analysis shows that poor data is obscuring the fact that significantly more patient cases are delayed due to Payer reasons and are actionable for reimbursement support teams. Bad data is preventing your teams from diagnosing patient access friction points and taking action in a timely manner, which is a fundamental goal of patient access analytics. The goal of any SP data & analytics implementation you pursue should be to shift from a model that has historically been retrospective to a much more proactive, even predictive, way to engage patients.
When multiple data points are integrated to understand First Fill sensitivity points, FRM teams are able to triage ‘actionable’ patient cases and execute tailored intervention strategies.
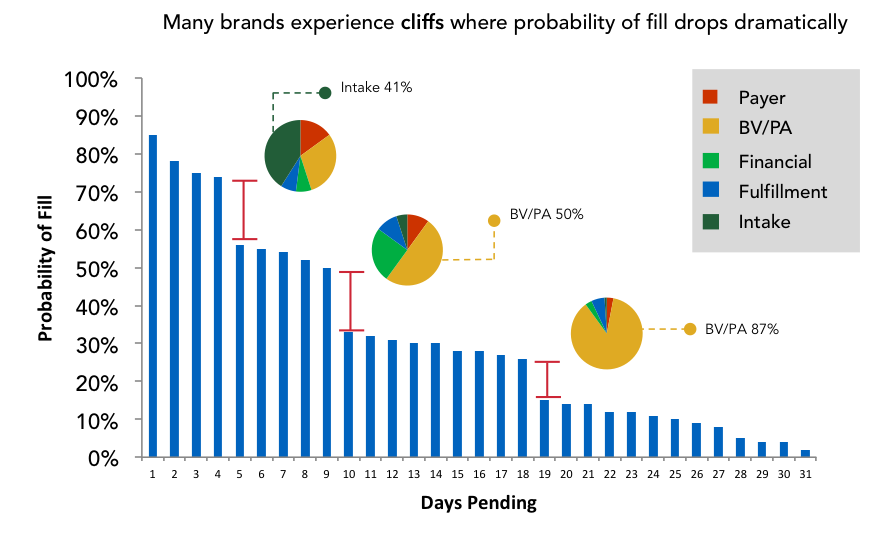
Figure 4: This analytic combines First Fill sensitivity points with Cancellation reasons to give FRM teams the insights needed to tailor patient intervention strategies to a point in time.
While each individual brand’s patient journey is unique, there will be abandonment cliffs where the probability of a script filling drops significantly at X number of days pending. When the analytics identify an abandonment cliff, diagnostics on Cancellation reasons at a given point in time tell the story of why patients are not initiating on therapy. In this example, the Intake process is a friction point early in patient access whereas policy restrictions like PA dominate as days pending accumulate.
Conclusion
The quality of status and sub-status data reported by SPs is an ongoing challenge that limits the actionability of data specialty brands have contracted to receive. Clearly, poor data quality limits the level of insights that analytics can surface for key stakeholders. Simply cleansing and stewarding Cancellation reasons unlocks tremendous value in understanding why patients are abandoning scripts. If your brand has implemented baseline capabilities for de-identification of Protected Health Information (PHI), patient data integration, and then immediately jumped to reporting, metrics, and visualizations, you haven’t addressed underlying data quality issues. A benchmark analysis of your brand’s SP data quality is a good place to start.