

Editor’s Note: The following post is taken from the Q&A session of IntegriChain’s 2021 Access Insights Conference: “Trends in Specialty Network & Service Design.” Responses have been edited for clarity. Click here to view the full webinar recording.
IntegriChain works with hundreds of pharmaceutical manufacturers to help them design their specialty network and service infrastructure. This ICyte Benchmark data contains information from IntegriChain’s ICyte Platform and is an analysis of more than 69 specialty brands across more than 20 manufacturers from Q3-2019 through Q2-2021.
First, we will review trends and specialty network sizes across the different therapeutic areas. We will also review leading specialty pharmacies (SPs) and how they rank volume-wise, paying attention to what type of pharmacies they are and looking at trends and design of distribution channels.
Network Size
Reporting on the number of specialty pharmacies in each network begs a few questions such as:
- Does network size vary by therapeutic area?
- What are the typical network sizes?
- Does network size correlate with units sold or patient populations?
To answer these questions, we created a scatter plot in which the Y-axis is units sold and the X-axis is the number of SPs for every brand. Each dot represents a brand that is color-coded based on its therapeutic area.
Oncology and Hematology
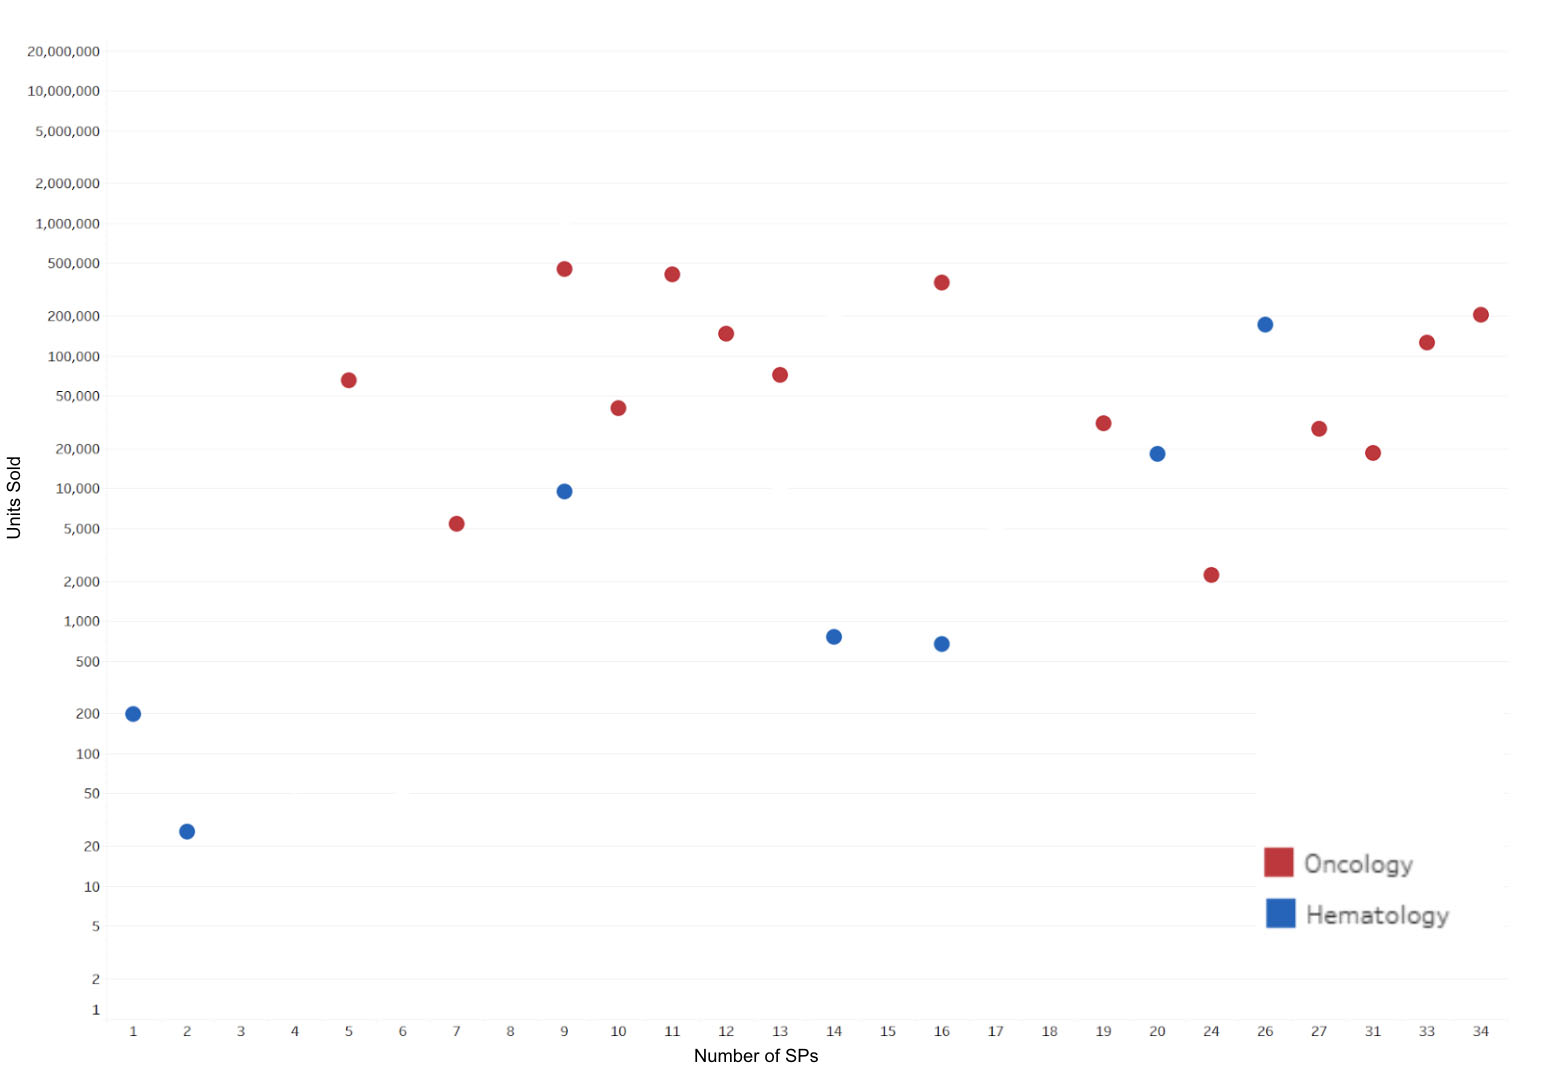
Insight: Oncology and hematology networks tend to be much larger (more than 10 SPs)
Starting with oncology and hematology, we can see that their networks are large and dispersed. Some of these brands have more than 30 SPs, which makes sense because these tend to follow an integrated therapy model that provides better patient outcomes given the complexity of these therapies. In addition to your typical SPs, these networks also have large academic medical centers and many oncology clinics that are close to the patient.
All Therapeutic Areas
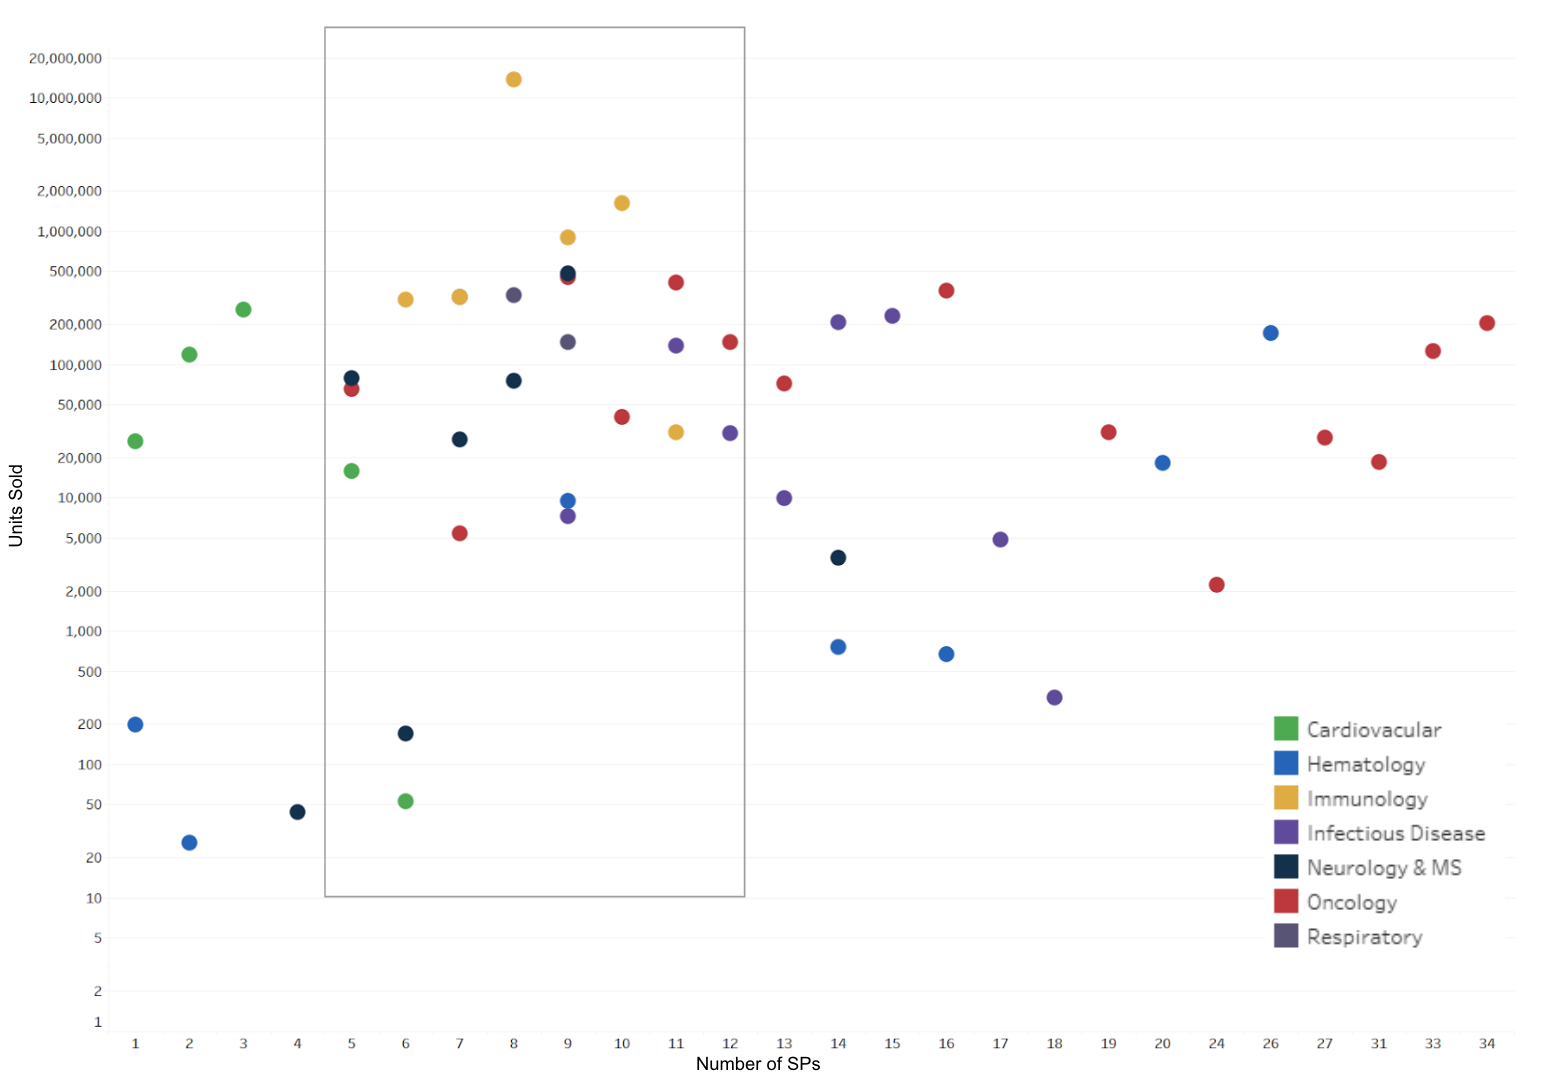
Insights
- 5 to 12 SPs seem to be the sweet spot for immunology, neurology, and respiratory.
- Cardiovascular therapies tend to have smaller networks (1 to 6 SPs).
When adding other therapeutic categories to this graph, we see that the majority of brands fall in the range of 5 to12 SPs. This seems to be the sweet spot, especially for immunology, neurology, and respiratory – the classic larger patient population specialty therapies. Looking at cardiovascular, these tend to have smaller or exclusive networks.
When we talk about the number of SPs, keep in mind that we’re really talking about the number of parent organizations. For example, let’s say that we have a drug and we have CVS Caremark in our network. The reality is there may be dispensing occurring out of multiple physical CVS locations, which is just counted as one partner in this study. So note that the number of pharmacies represented here is not necessarily literally the number of pharmacies by DEA code, but rather by the parent organization. Personally, I was fairly surprised by this data as I think many of us have this perception that the majority of specialty pharmacy networks out there are very small.
Specialty Pharmacy Presence by Therapeutic Area
Number of brands (in the study) having a pharmacy in the network
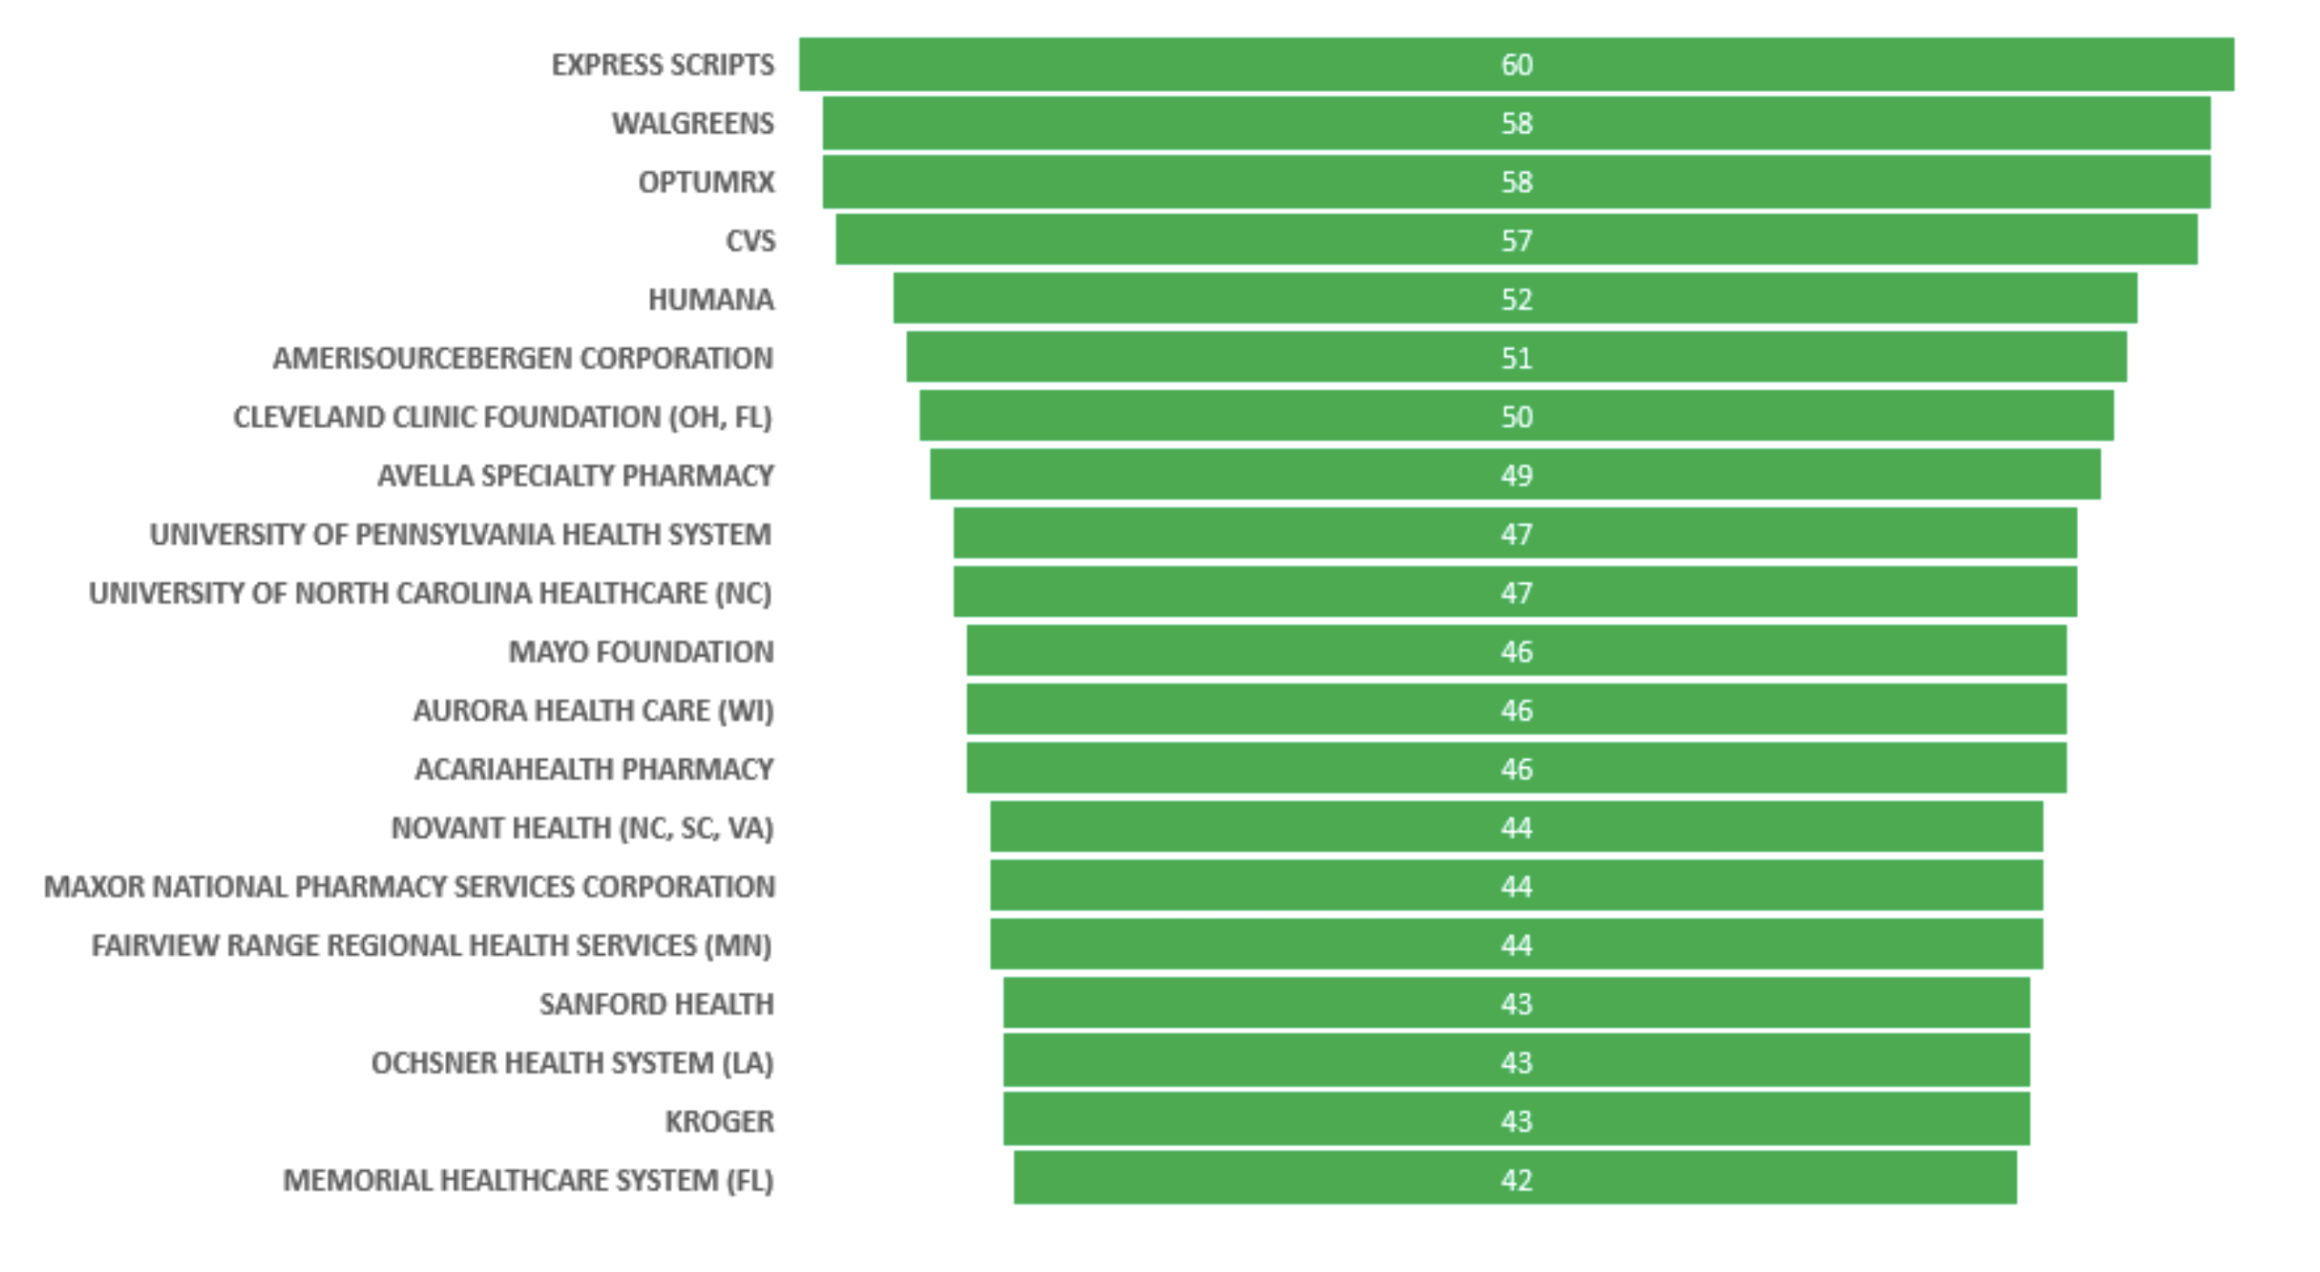
69 Specialty Brands
Keeping the parent name of the specialty pharmacy in mind, these trends show the number of brands that have a specific pharmacy in their network. For example, of these 69 brands, 60 have Express Scripts in them. On the lower side, for example, Kroger is in 43 brands. We also did a similar analysis, broken down by the biotherapeutic area, which is what you see on the right. Now you can see in detail the rates of network participation by therapeutic areas in terms of specialty pharmacies and understand network design from a competitive perspective.
When you’re preparing for a launch, knowing how these dispensing networks have been developed can help your brand be more data-driven in your partner selection. This would be a great lens for the manufacturers to help in their RFP process with SPs, especially if we overlay it with other information such as volume share, pharmacy type, and even payer mix information.
Top-10 Specialty Pharmacies
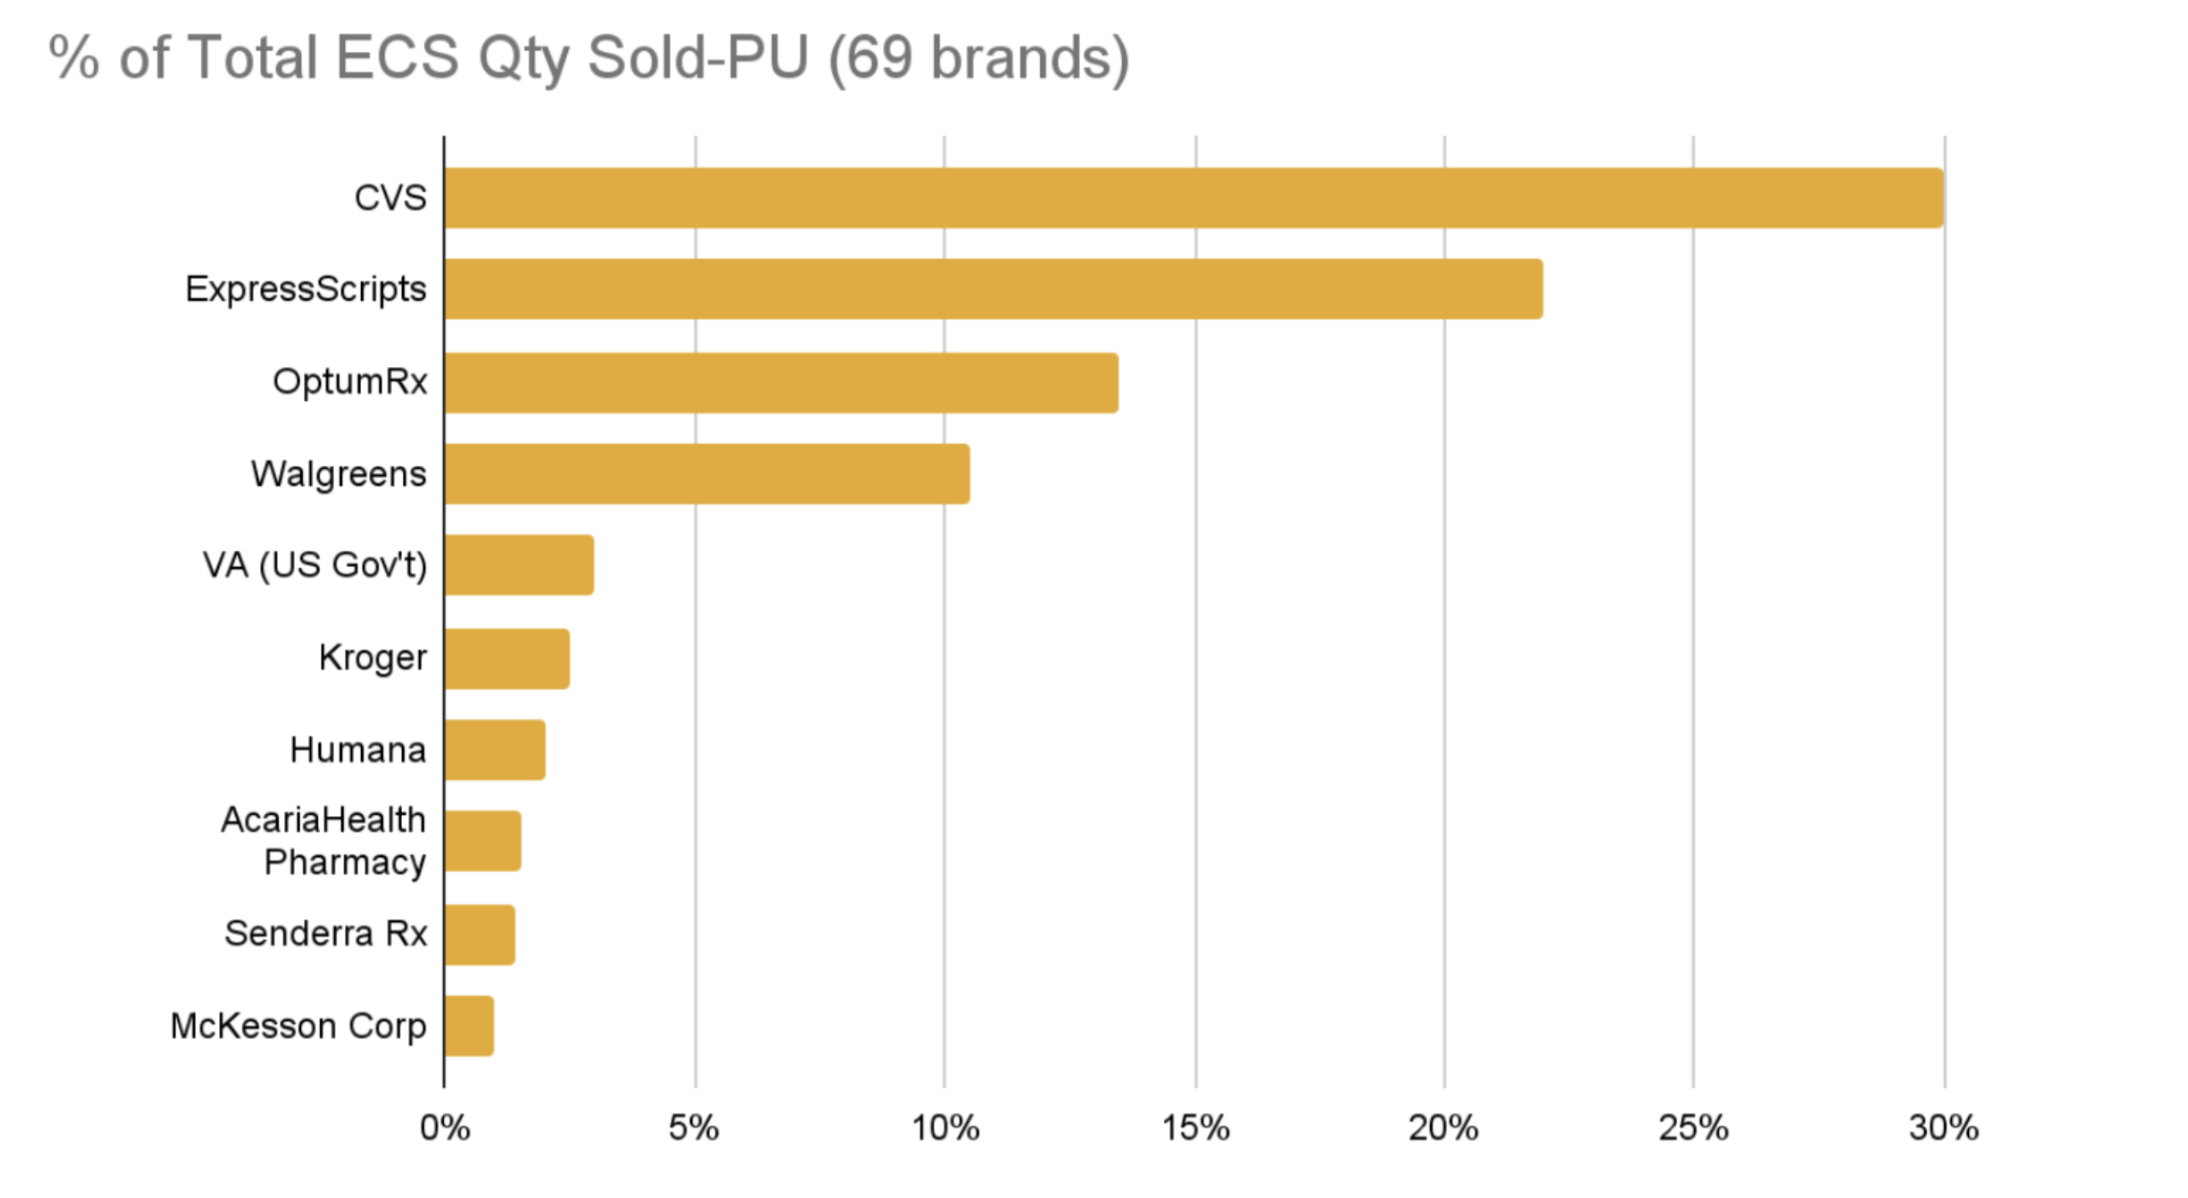
Insights
- The top-four SPs – CVS, Express Scripts, OptumRx, and Walgreens – represent 73% of the total SP market.
- CVS is by far the top dispensing SP in most therapeutic areas.
This trend looks at the SP share from a volume perspective. It’s no surprise that CVS is further ahead with the lion’s share of about 30% of the total market. Right behind comes Express Scripts, and then Optum and Walgreens in third and fourth place, respectively. The top-four combined represents about 73% of the total specialty market. Now more than ever, it’s interesting to see how concentrated dispensing is in payer-owned specialty pharmacies
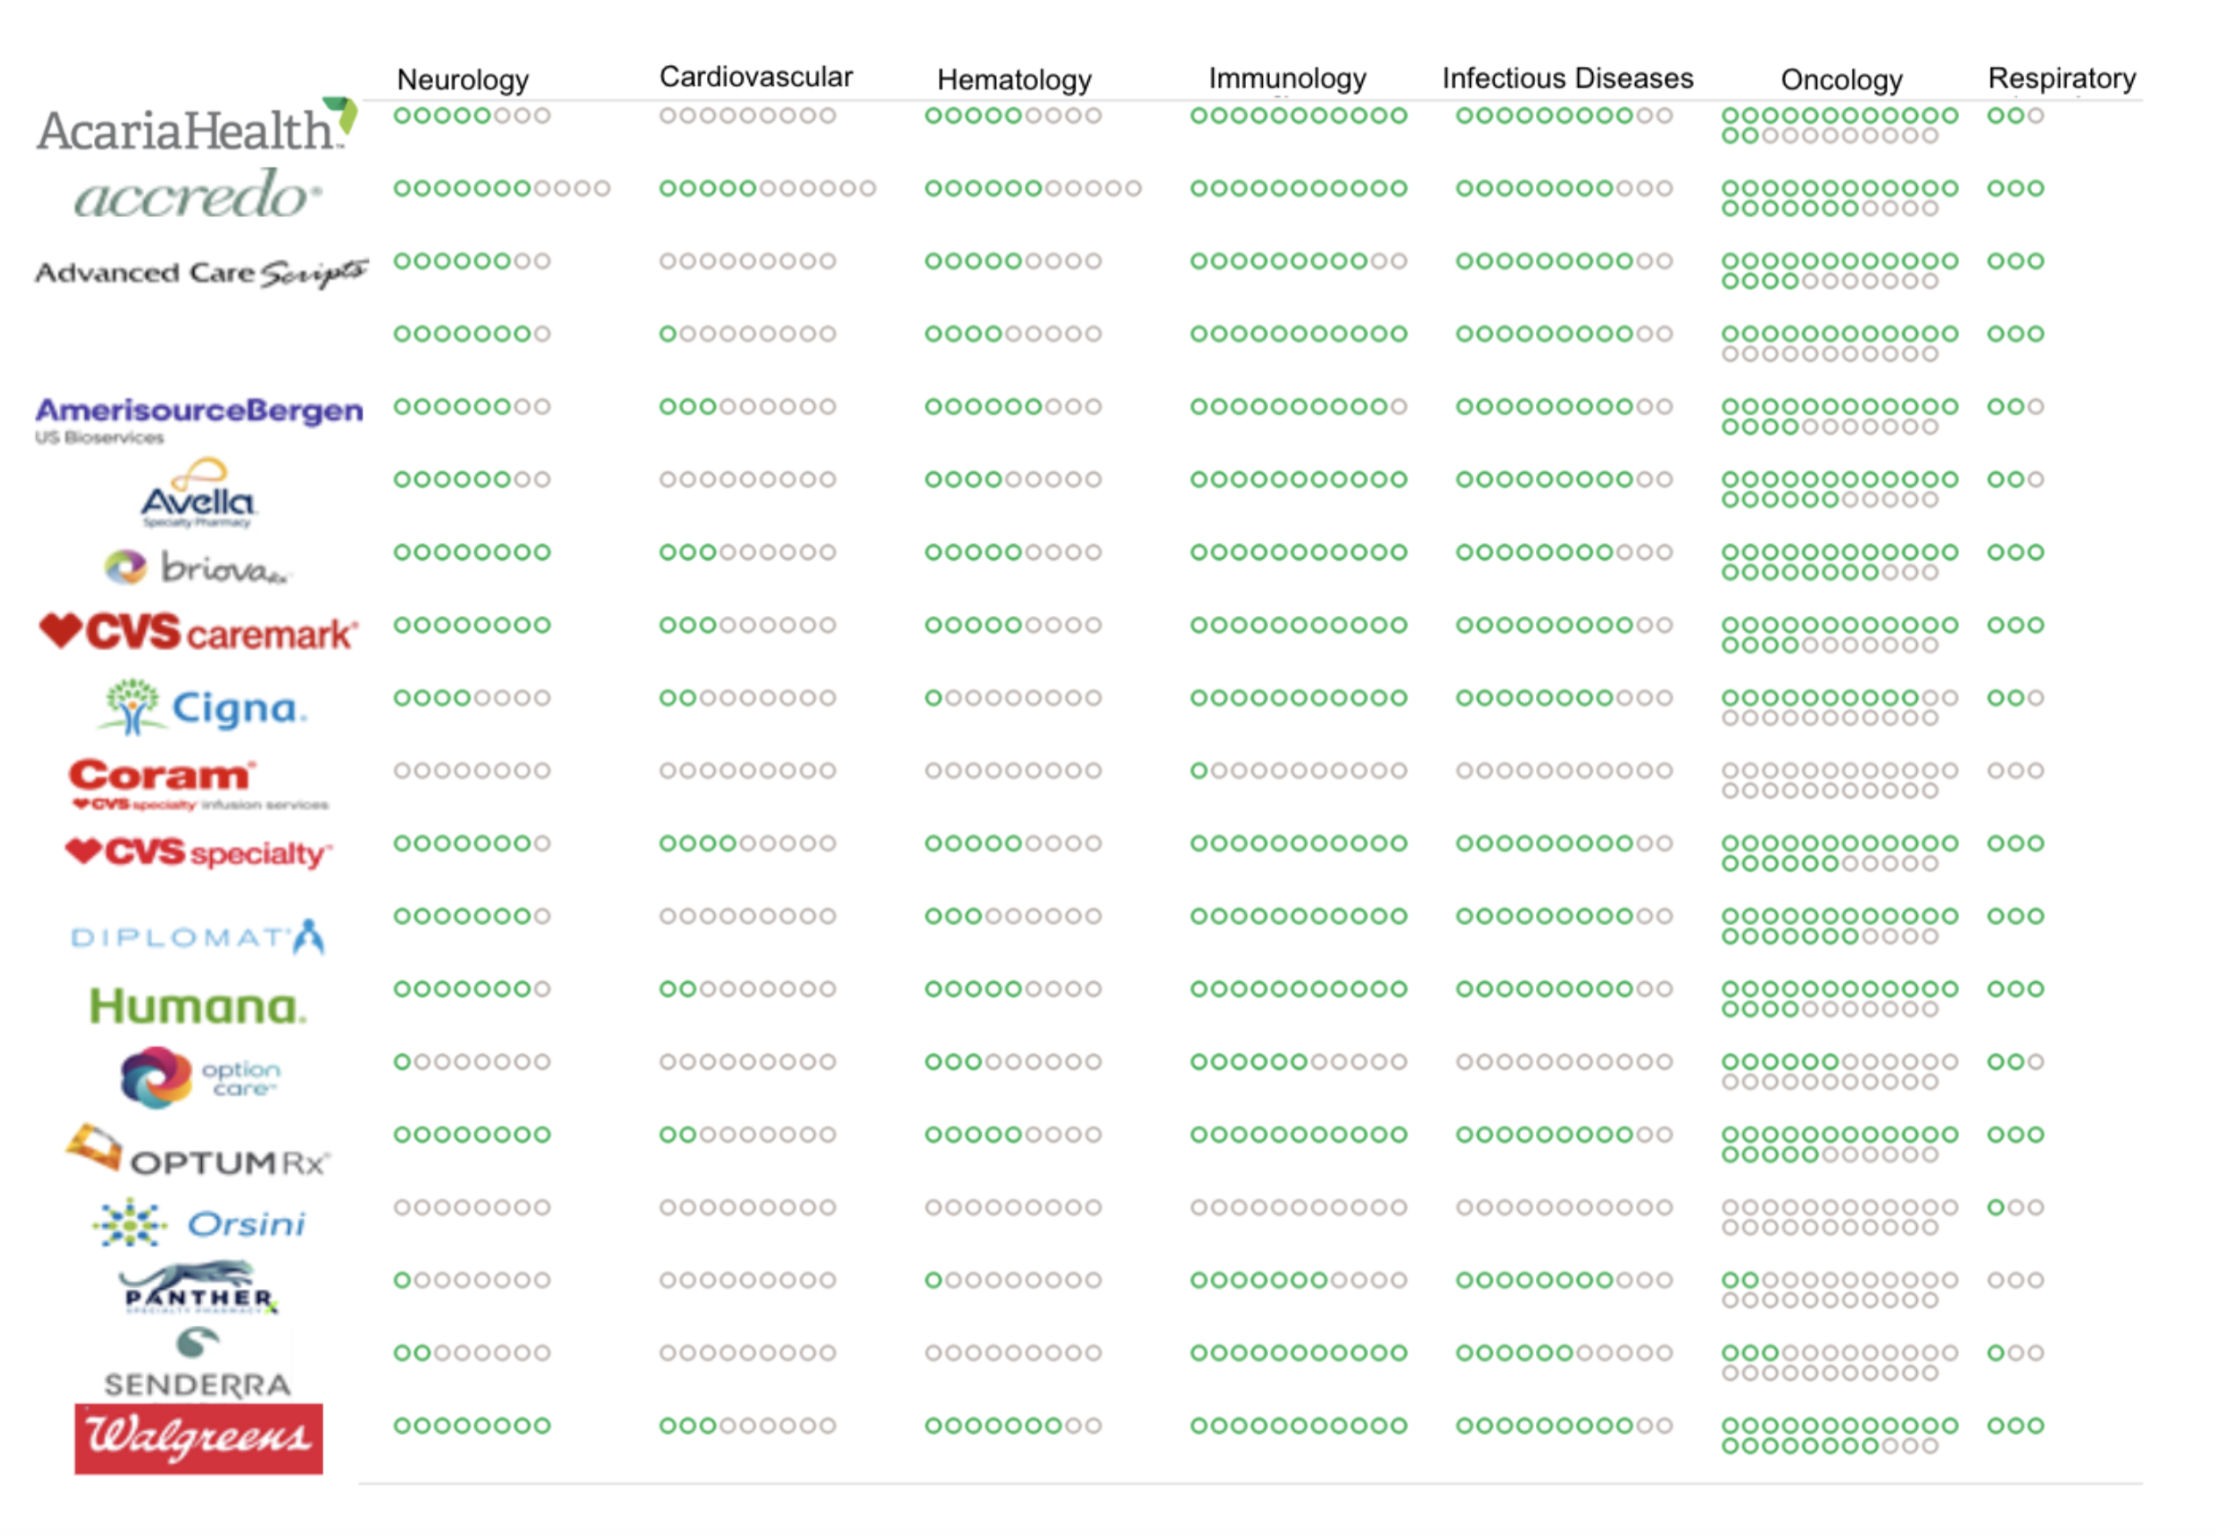
Specialty Pharmacy Share by Therapeutic Category
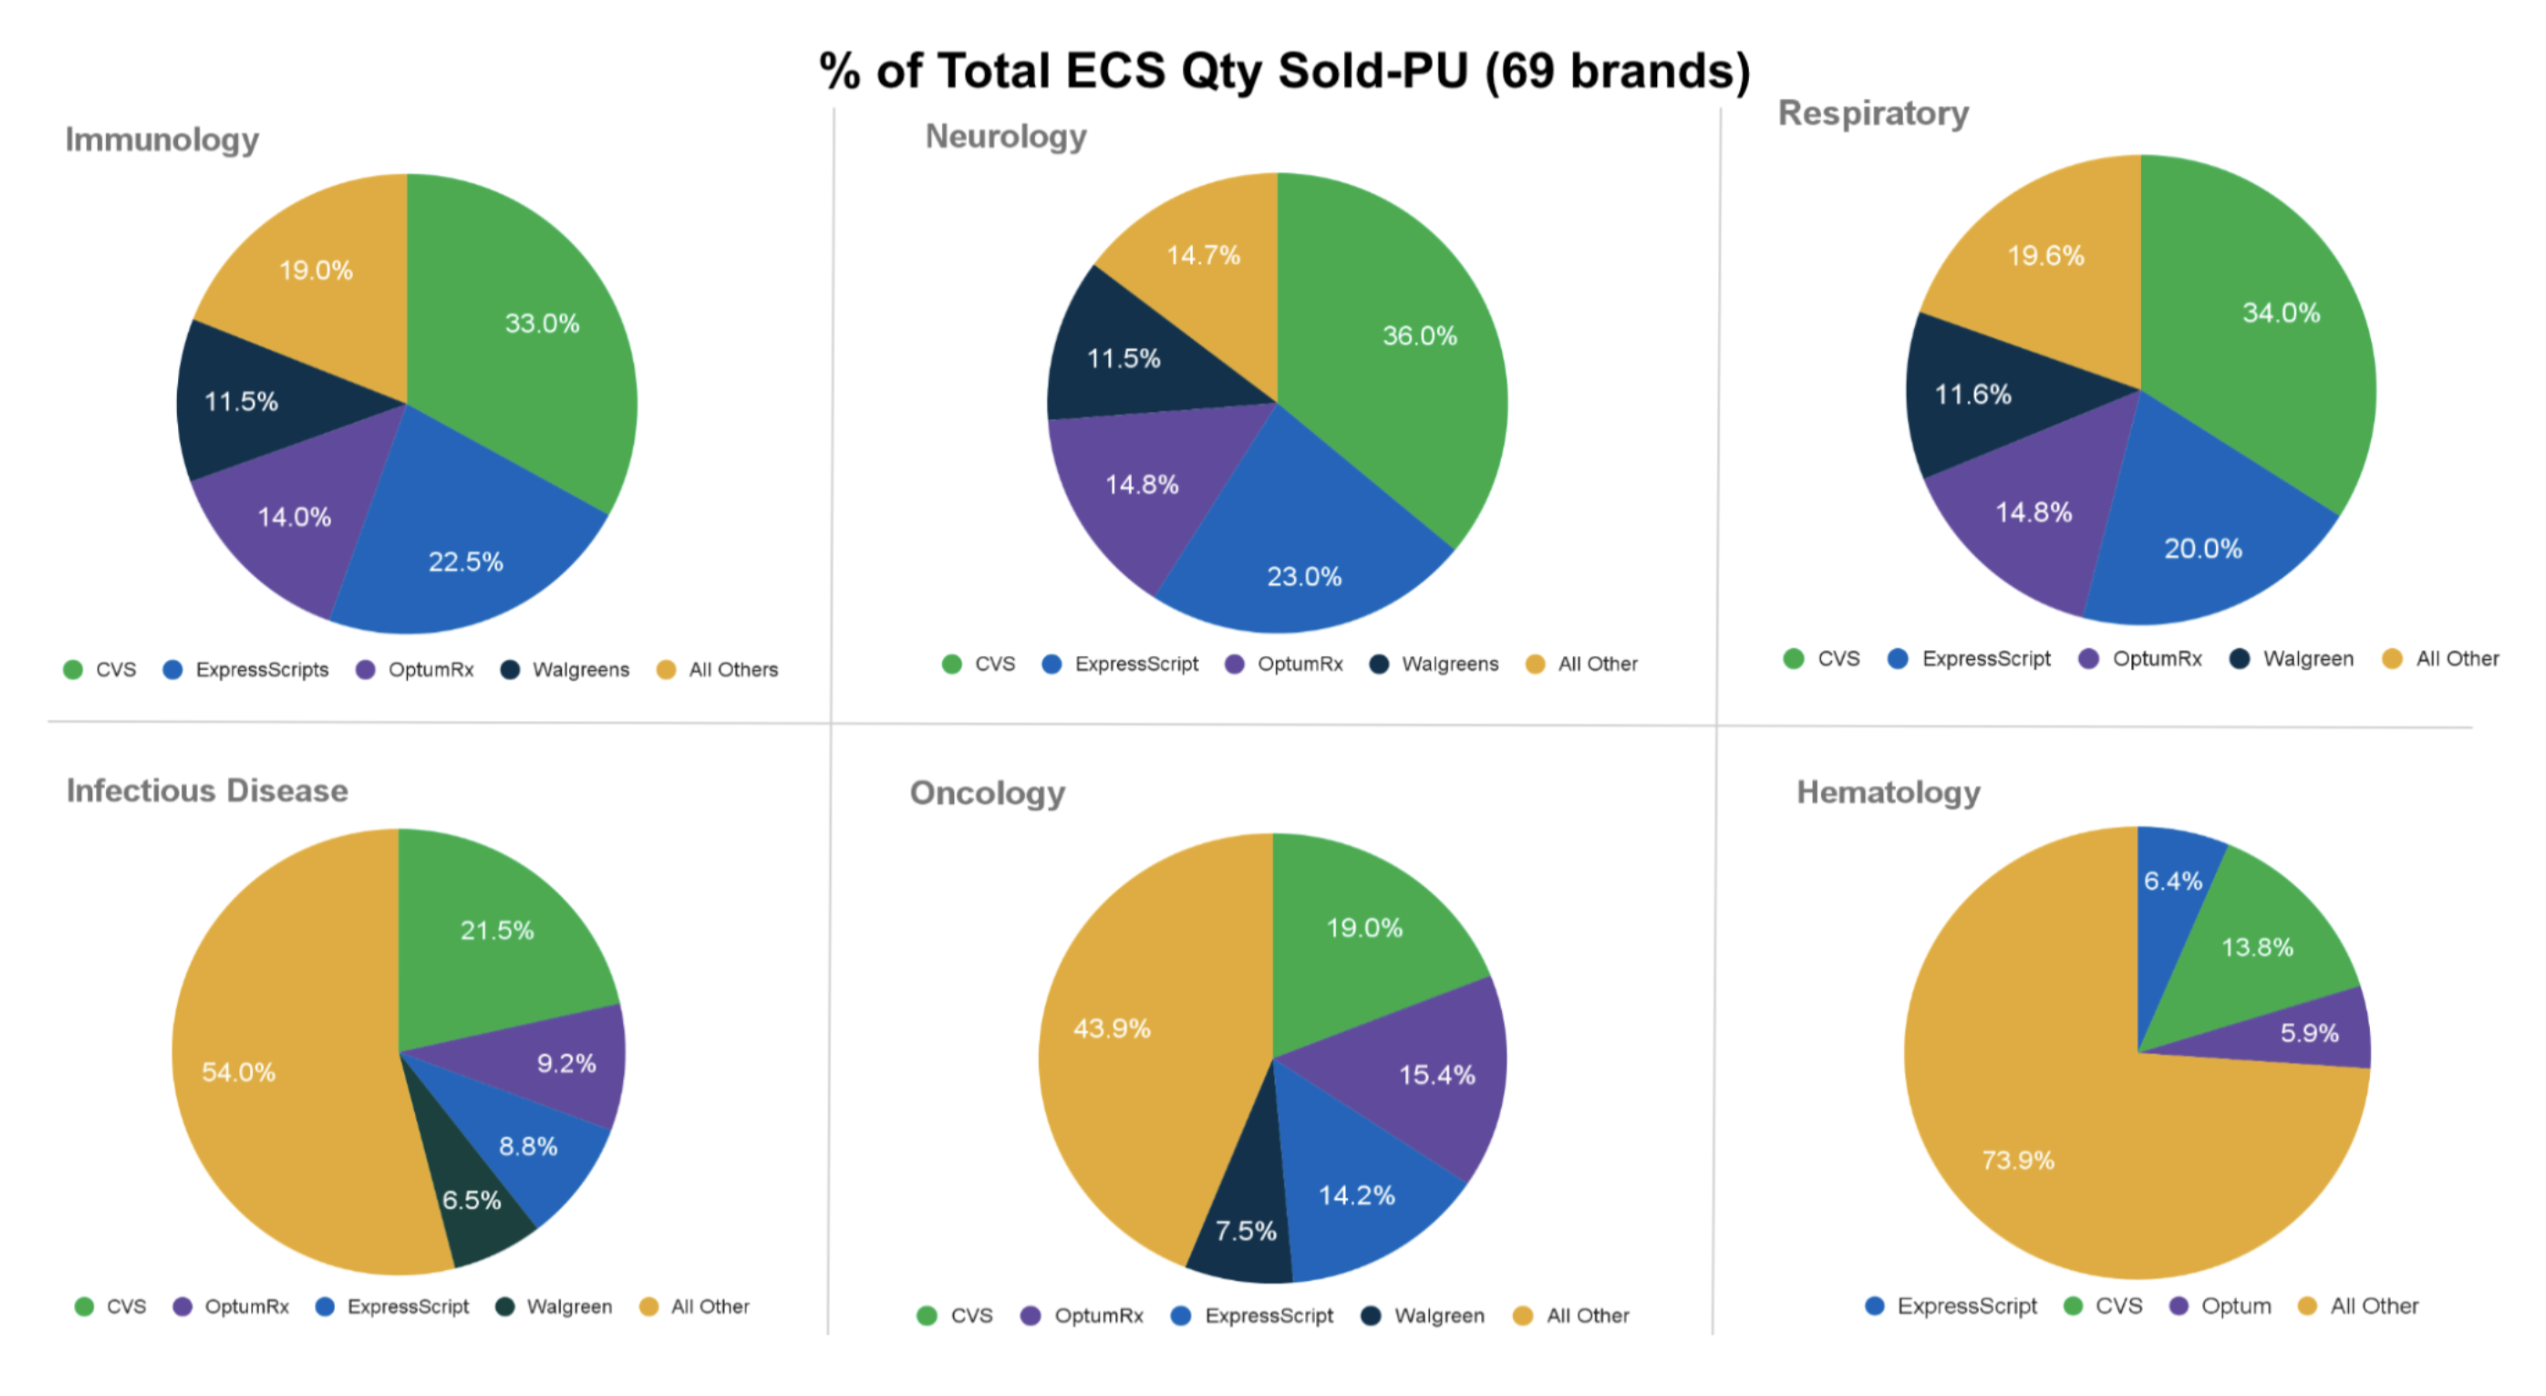
This trend breaks down SP volume shares by therapeutic area. We see a consistent theme in the top three charts – immunology, neurology, and respiratory – where the big four SPs dispense most of the volume. This is not the case for the bottom three – infectious diseases, oncology, and hematology – where smaller pharmacies (the gold area), take on a considerable proportion.
72% of Specialty Pharmacy Market Is Payer-Owned
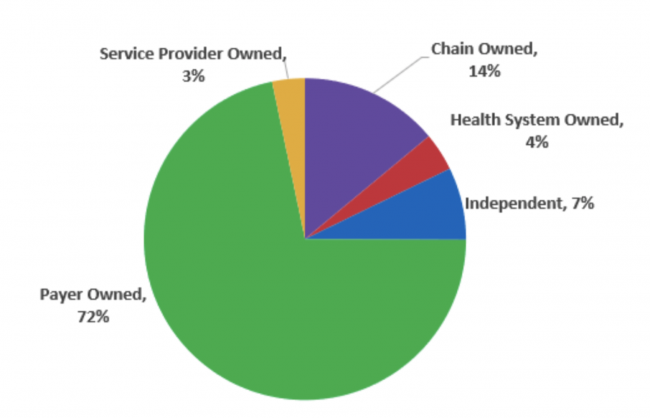
In this graphic, we look at the network composition from a pharmacy-type perspective. Whether they are payer-owned, chain-owned, an independent health system, or service provider-owned, payers and PBMs own some of the largest SPs and we see that clearly in the data. About 72% of the market is owned by payer-owned SPs, 14% is owned by chain pharmacies, and the rest is divided across independent pharmacies, health systems, and service providers. This predictable, direct ownership of specialty pharmacies is very attractive to payers for a number of reasons. Of course, it serves as an additional revenue stream but it also gives them better control of drug acquisition costs, therapy management, and better control on reimbursement procedures.
Payer-Owned Specialty Pharmacies Market Share
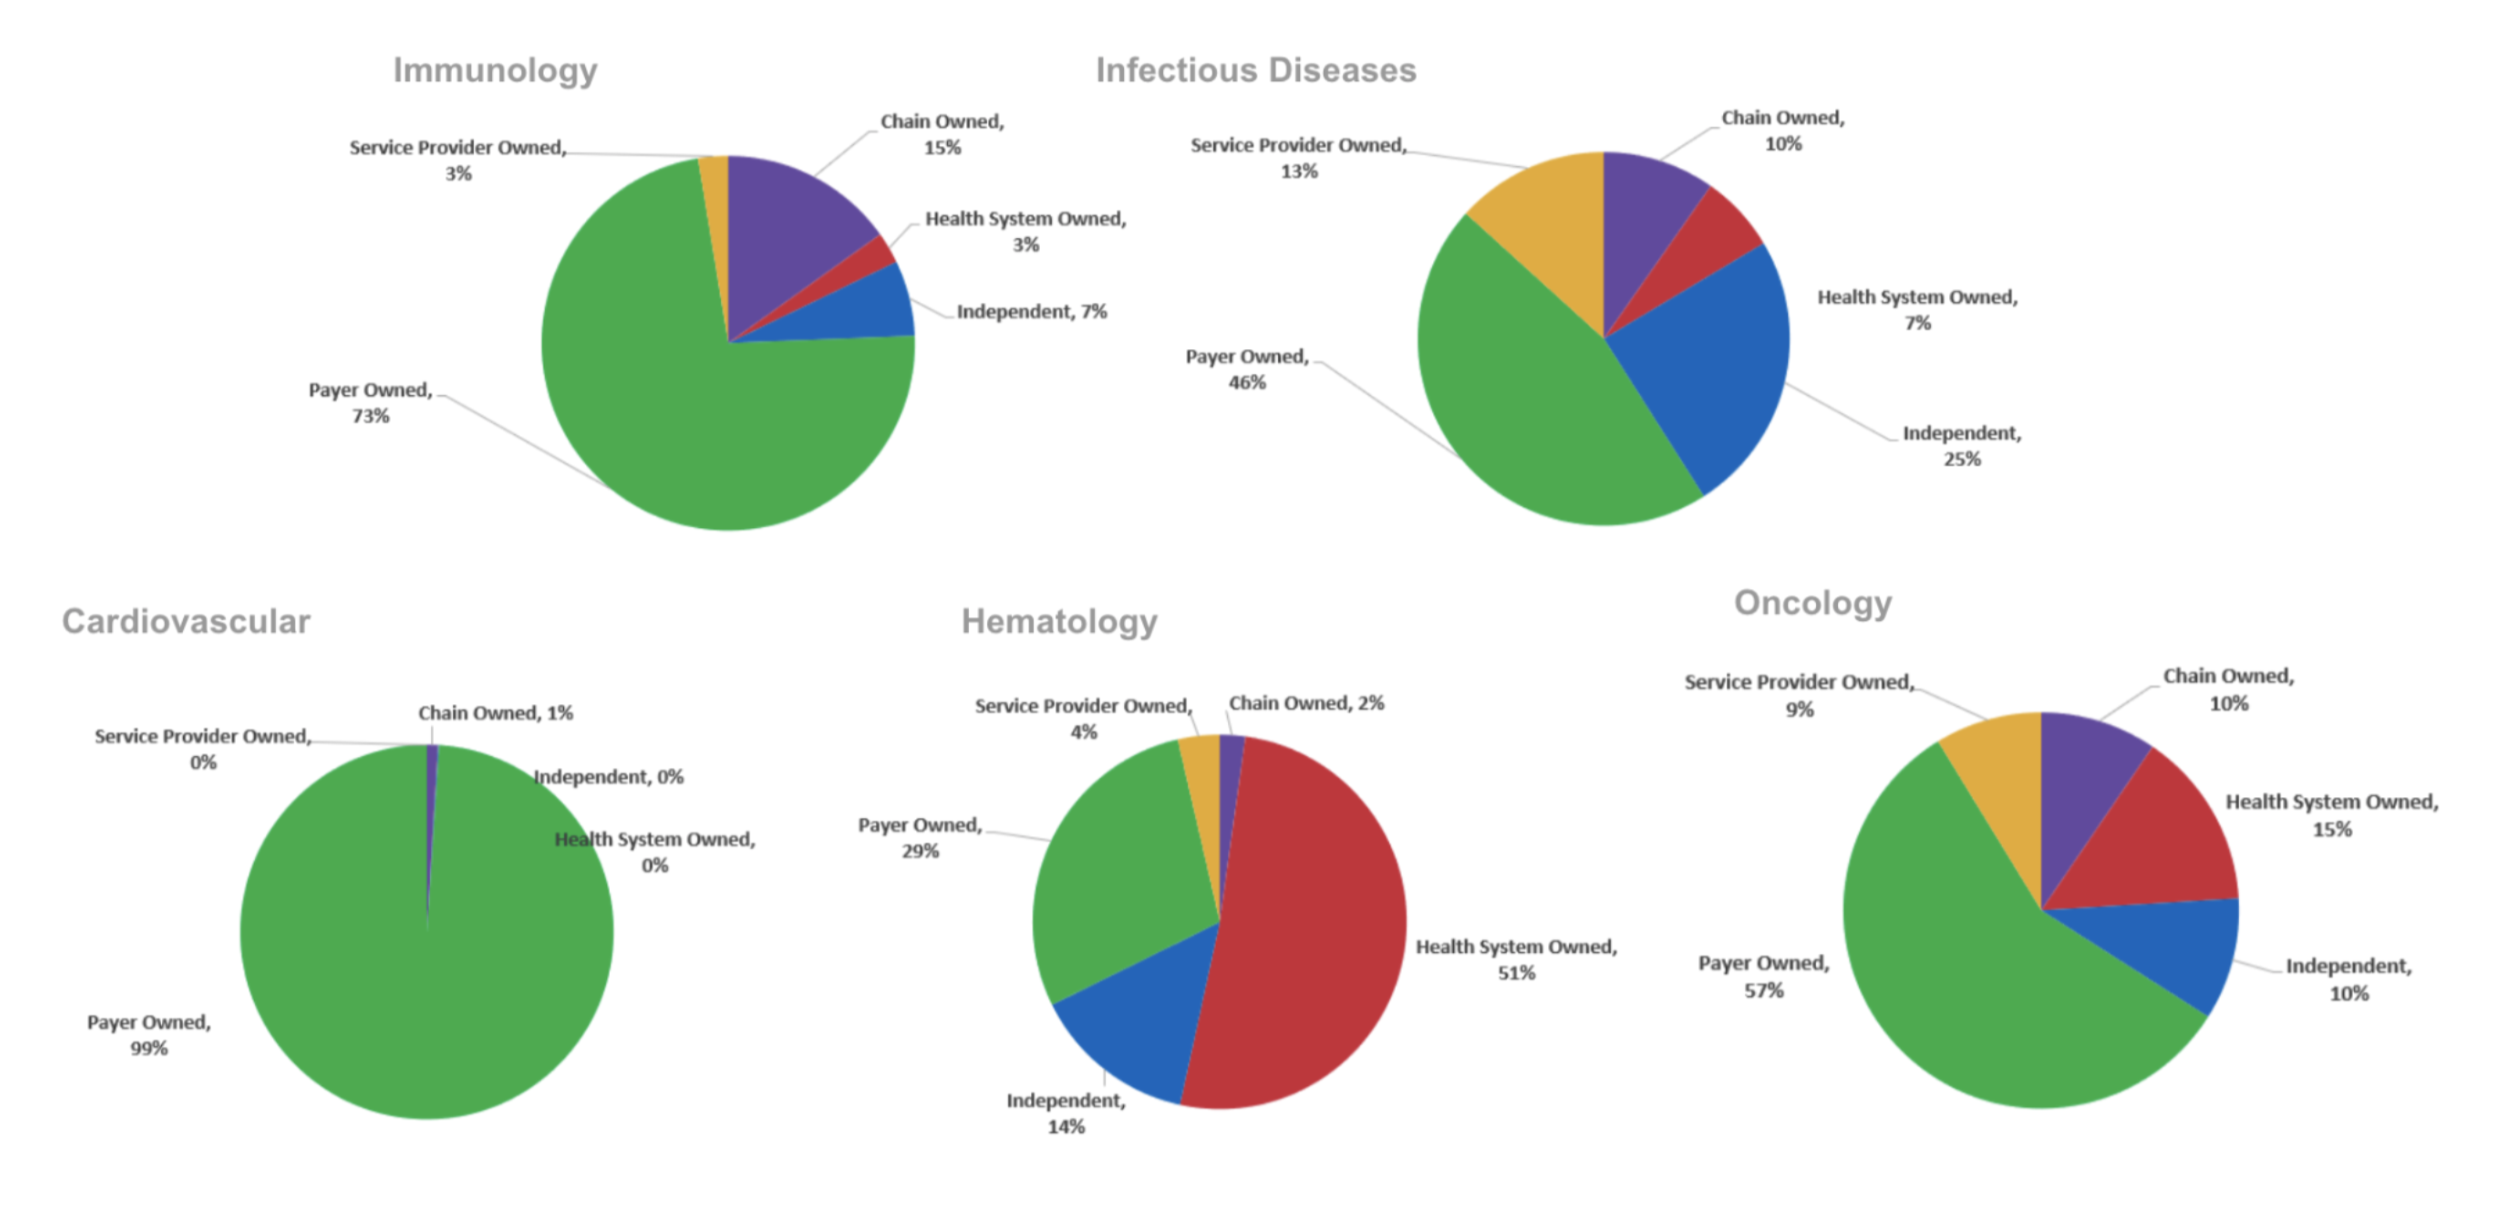
Insights
- Overall SP Market: 72%
- Cardiovascular: 99%
- Infectious Disease: 45%
- Oncology: 57%
- Infectious Diseases: 46%
This mix is not necessarily consistent across the different therapeutic areas. For example, in oncology, health systems and service providers have made a lot of progress and there are many home infusion providers that roll up to that. So we see health systems jump to 15% and service provider-owned SPs jumping to 9%. Payer-owned and chain-owned together is around 67%, which is still considerable. If we jump to immunology, by comparison, payer-and chain-owned is about 88%. So you are clearly able to see where service providers and health systems gain in oncology, going from almost nothing to about 24%.
When we looked at the payer-owned specialty pharmacies 15 to -20 years ago, providers in the marketplace talked about big box stores with very little patient services. As our markets have evolved and we’ve gotten more and more into personalized medicine, these payer-owned specialty pharmacies have definitively invested the time and the resources to create a solution that is patient-centric. Mergers and acquisitions have played a role in this, but we also have to give payer-owned SPs credit for understanding the way the market was evolving and investing in the resources to make sure that they meet patient needs down the road.
Benchmarking Distribution
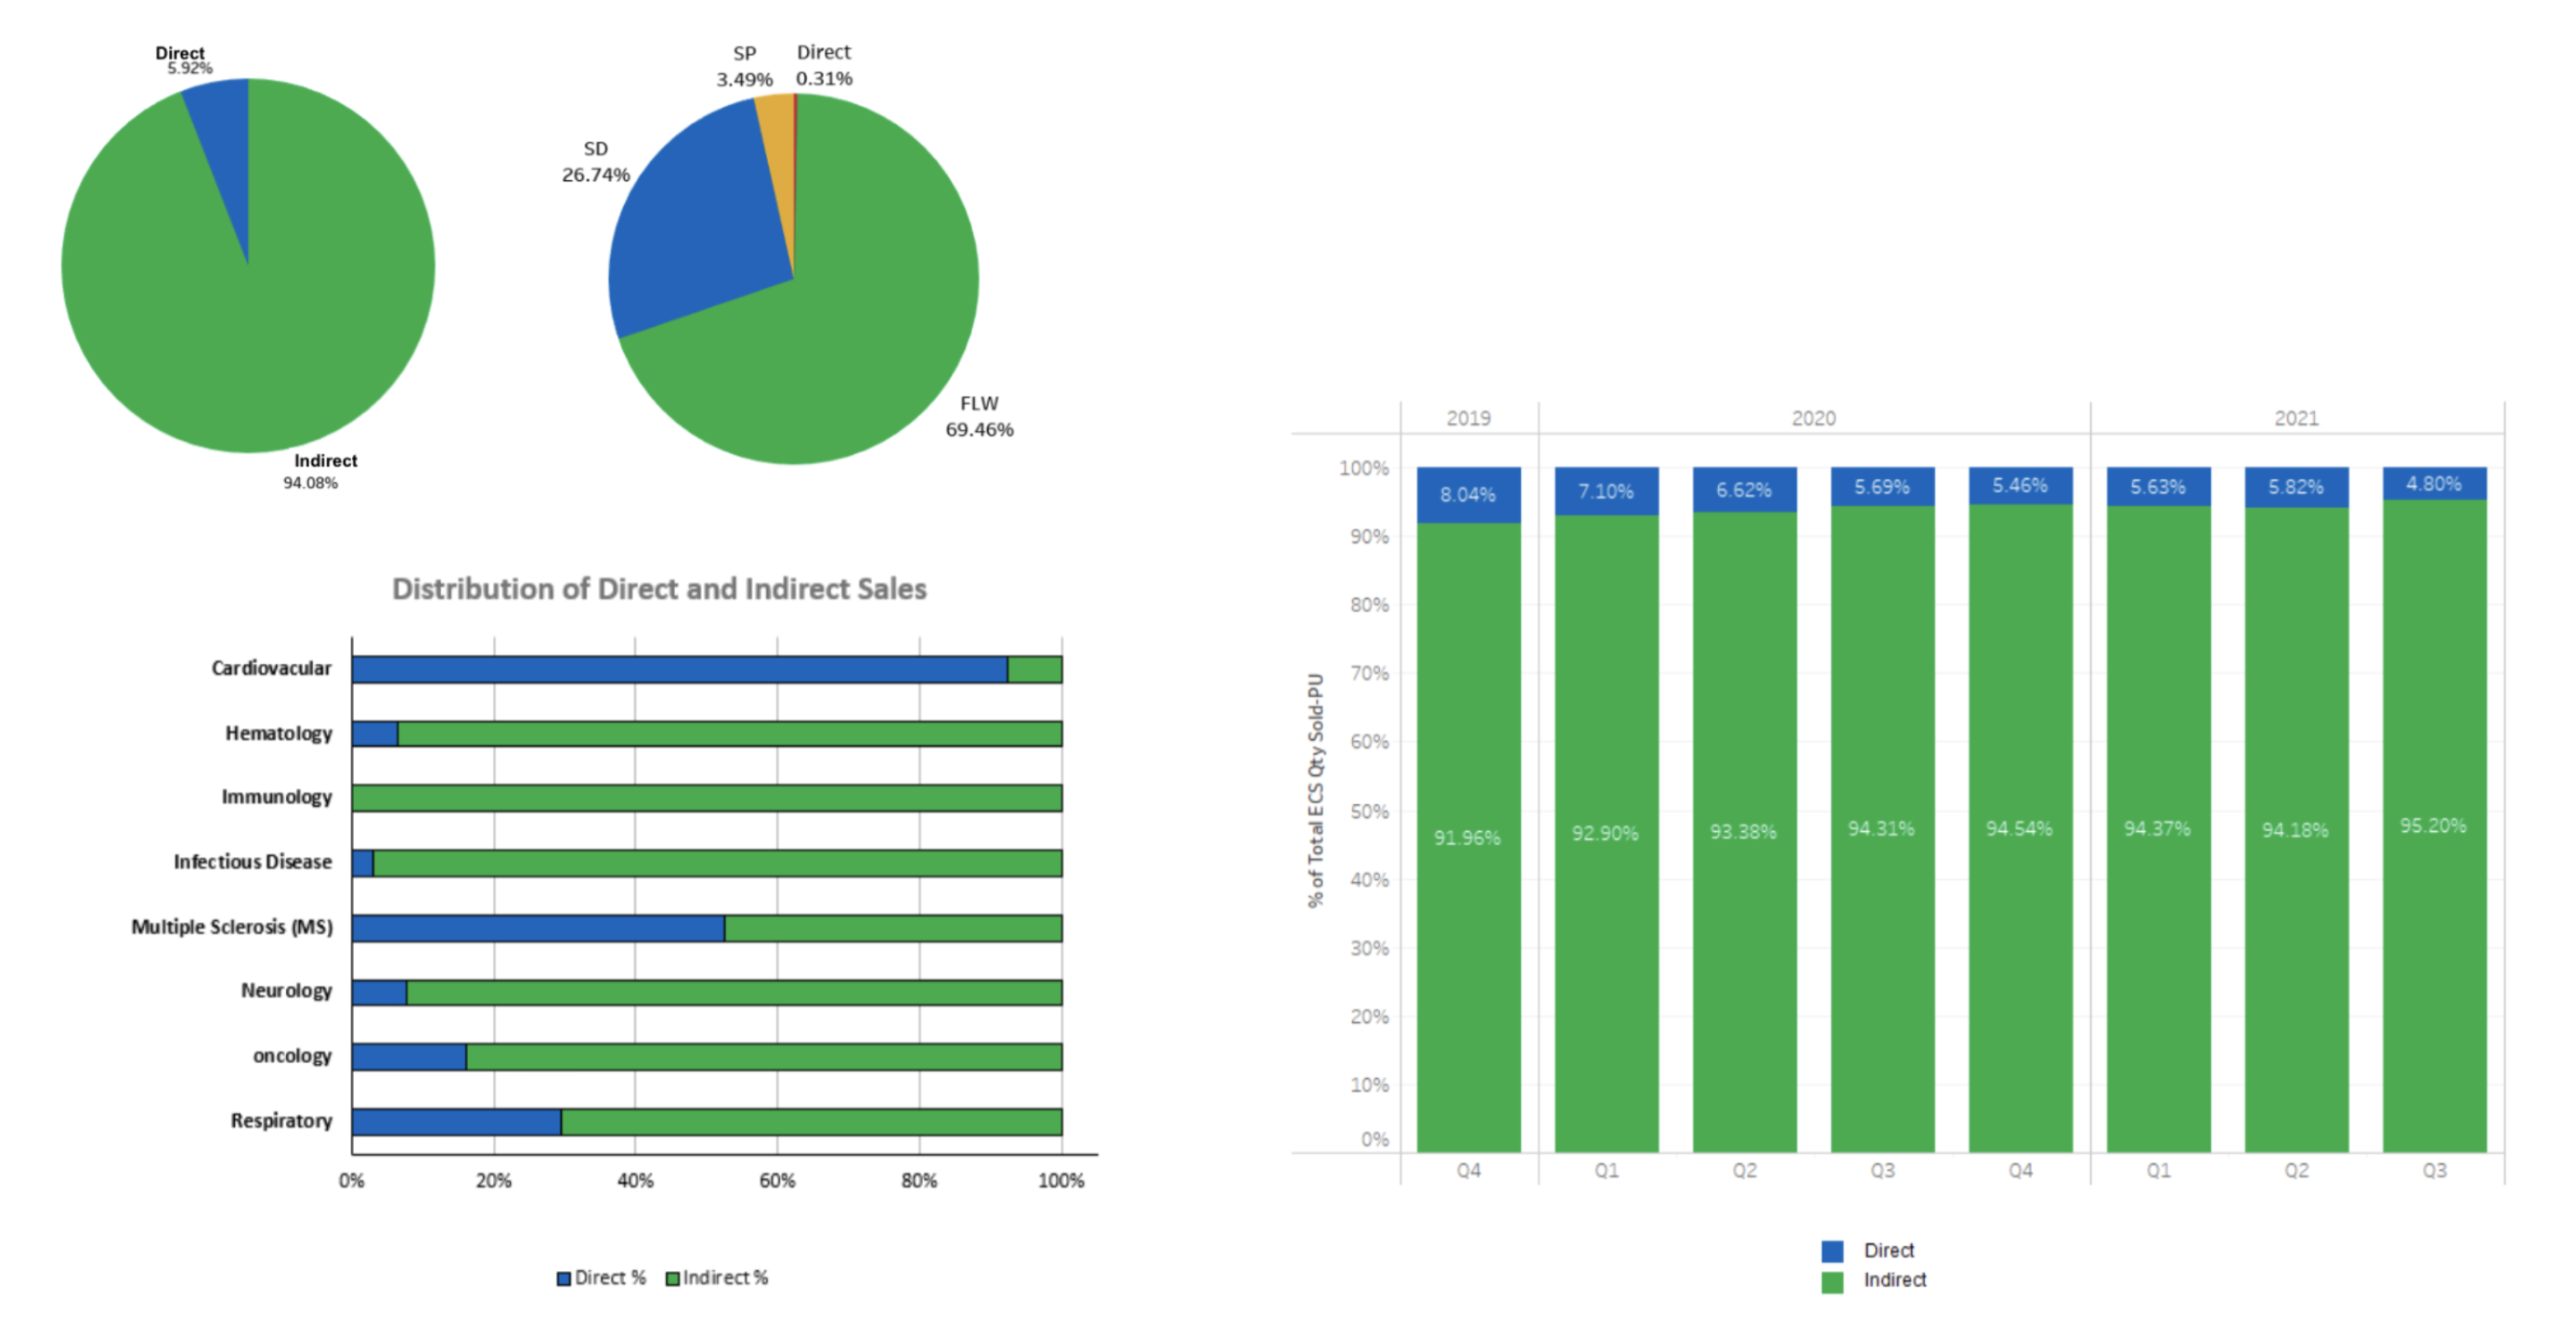
Insights:
- Slight decline in direct sales over the last four quarters
- Indirect sales account for 94% of specialty sales across products
This last trend deals with distribution channels. We see the vast majority – about 94% – of the distribution network to be in direct sales through mostly wholesalers and specialty distributors, with the ratio of wholesale to specialty distributors at about 3:1. We can also see similar trends if we break it down by the different categories. This might be because these categories are over-sampled with bigger pharma companies that have healthy trade economics, but of course, this economic model would be very challenging for smaller organizations where we would see more of the direction and the 3PL models.
Navigating Specialty Network and Service Design Now and in the Future
Looking at how the traditional wholesale model has evolved and the pressures put on manufacturers both from a channel and gross-to-net perspective. As a result, small and mid-size organizations are going to seek alternative distribution strategies. These small and mid-size organizations find that it’s hard to compete with larger organizations because of the financial pressures put upon them. In a way, the traditional wholesale model is still struggling to figure out what it’s going to look like in the future since we’ve seen such a huge shift in dollars from traditional retail into the specialty marketplace.
Not to mention, as the industry continues to shift toward precision medicine and specialty therapies, this has also necessitated new channel and specialty pharmacy network designs.
To stay on top of these fluctuating industry trends, it’s important to have a partner like IntegriChain identified to help you maximize your channel investment, gain deeper insight into product utilization and availability, and navigate ever-changing network and service designs including retail, specialty pharmacy, and buy-and-bill as well as emerging hybrid models.
Use data science to drive winning distribution strategies
About the Author

Samer Allabadi
Samer Allabadi offers 20 years of experience in Life Sciences data and information. He joins IntegriChain from CapGemini and will partner with Trade and Patient Access teams on key data mining, analytics, and visualization projects including pharmacy segmentation, returns forecasting, retail inventory analytics, data quality audits, specialty pharmacy data strategy, and specialty pharmacy readiness. He earned a BS and MBA from Temple University.