

Editor’s Note: The following post is taken from the Q&A session of IntegriChain’s 2021 Access Insights Conference: “Benchmarks and Trends in Contracting.” Responses have been edited for clarity. Click here to view the full webinar recording.
IntegriChain works with hundreds of pharmaceutical manufacturers to help them establish their contracting strategies. Through our work, we have exclusive access and insight into pricing and contracting trends from our own ICyte Platform and data assets. This ICyte Benchmarks data comes from more than 230 brands across more than 50 manufacturers, spanning the last two calendar years ending with the third quarter of 2021. We’ve condensed the most compelling trends to discuss contracting trends as it relates to specialty medicines.
Payer Contracting Continues to Consolidate
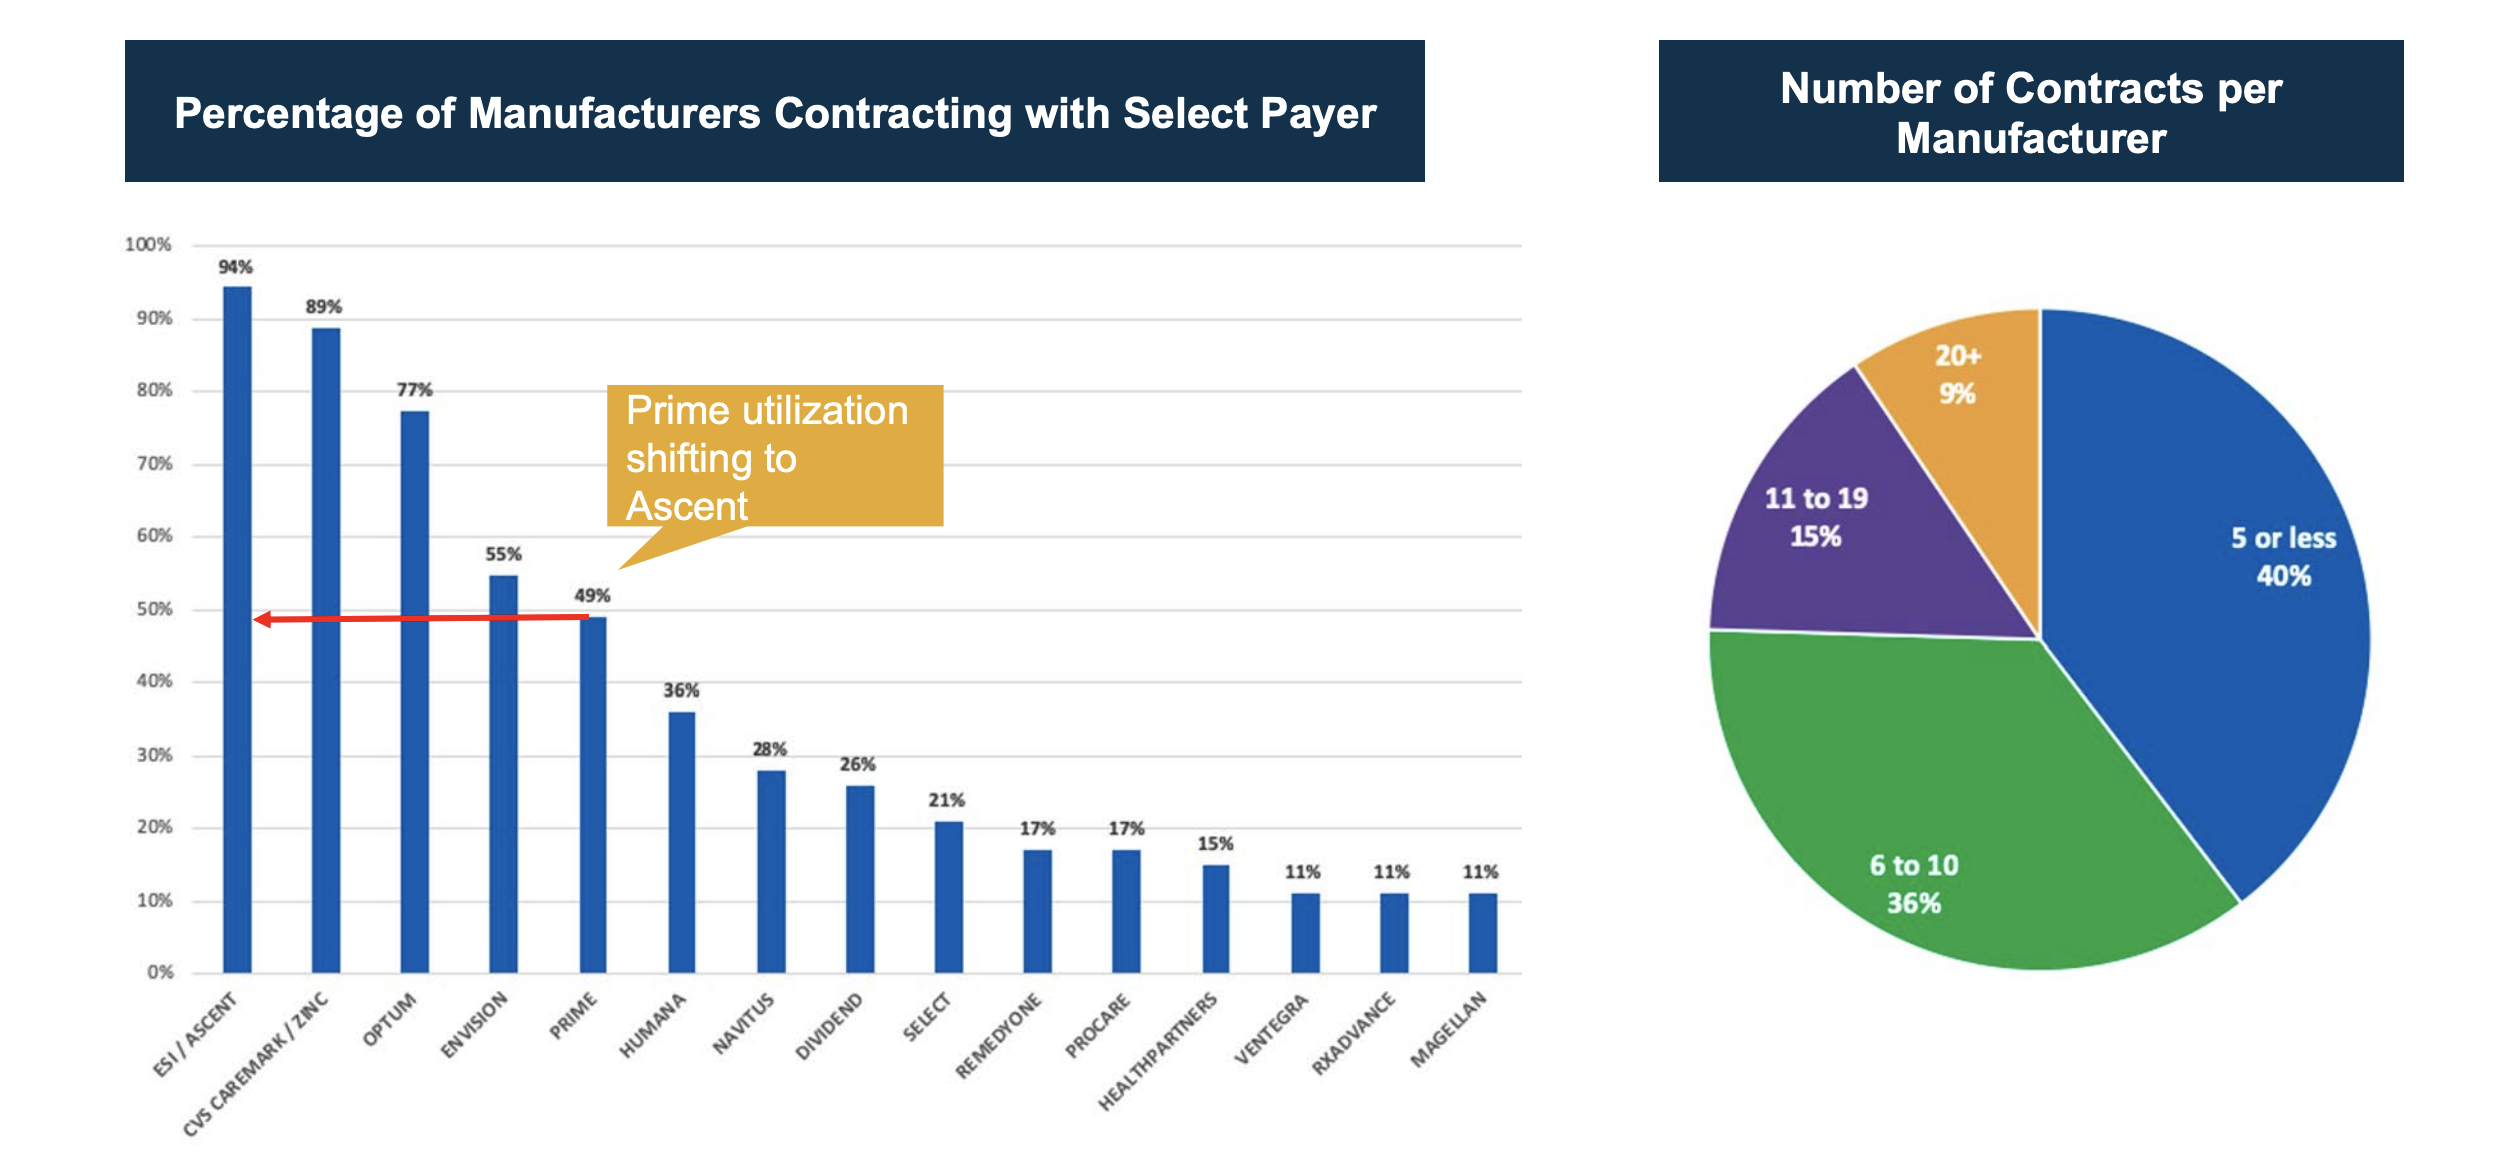
Our data shows the dramatic consolidation of power within the big three PBMs. Virtually all manufacturers – 94% of them – contract with ESI/Ascent. Similarly, a large proportion of them contract with the other two leading PBMs: 89% with CVS and 77% with Optum. From there, there is a dramatic drop-off with some of the small and more regional PBMs and payers. This is not a stagnant trend; in fact, we continue to see this playing out with more and more consolidation.
Further evidence of contracting consolidation can be seen in the chart on the right above. About 40% of manufacturers in this ICyte Benchmark study contract with five or fewer payers, and 36% contract with six to ten. Only about 25% contracting with more than ten payers.
This consolidation shouldn’t be a surprise to manufacturers. Market access professionals are tasked with ensuring that patients who need access to medications can get them. They are constantly thinking about who they need to engage with and what levers to pull to ensure they maximize access. There’s a lot of consolidated power up in those large PBMs and payers with their huge volumes of patients, so it’s a no-brainer for contracting from a therapy launch perspective, while building a business model, it’s important to know who these entities are and what it’s like to do business with them. If the end goal is to make sure that patients have access to the medications, most likely manufacturers will need to enter into some type of contractual relationship with these entities.
Another really important takeaway from this benchmarking data is that beyond the obvious implications of vertical integration, how are relationships with these PBMs evolving? It’s important to recognize the importance of that relationship relative to being payer-owned or vice versa, not to mention the simple fact in many cases that they have their own specialty pharmacy as well. For as many firewalls that they suggest exist, there is a reality between how that payer, PBM, and specialty pharmacy relationships play off of each other and it is important to be aware of what is driving decisions. And lastly, those manufacturers with fewer contracts are likely to focus more on the pharmacy benefit side than on the medical benefit side because they can go directly to the PBM and likely expect cascading of that contract across their payer clients.
Payer Market Share by Therapeutic Class
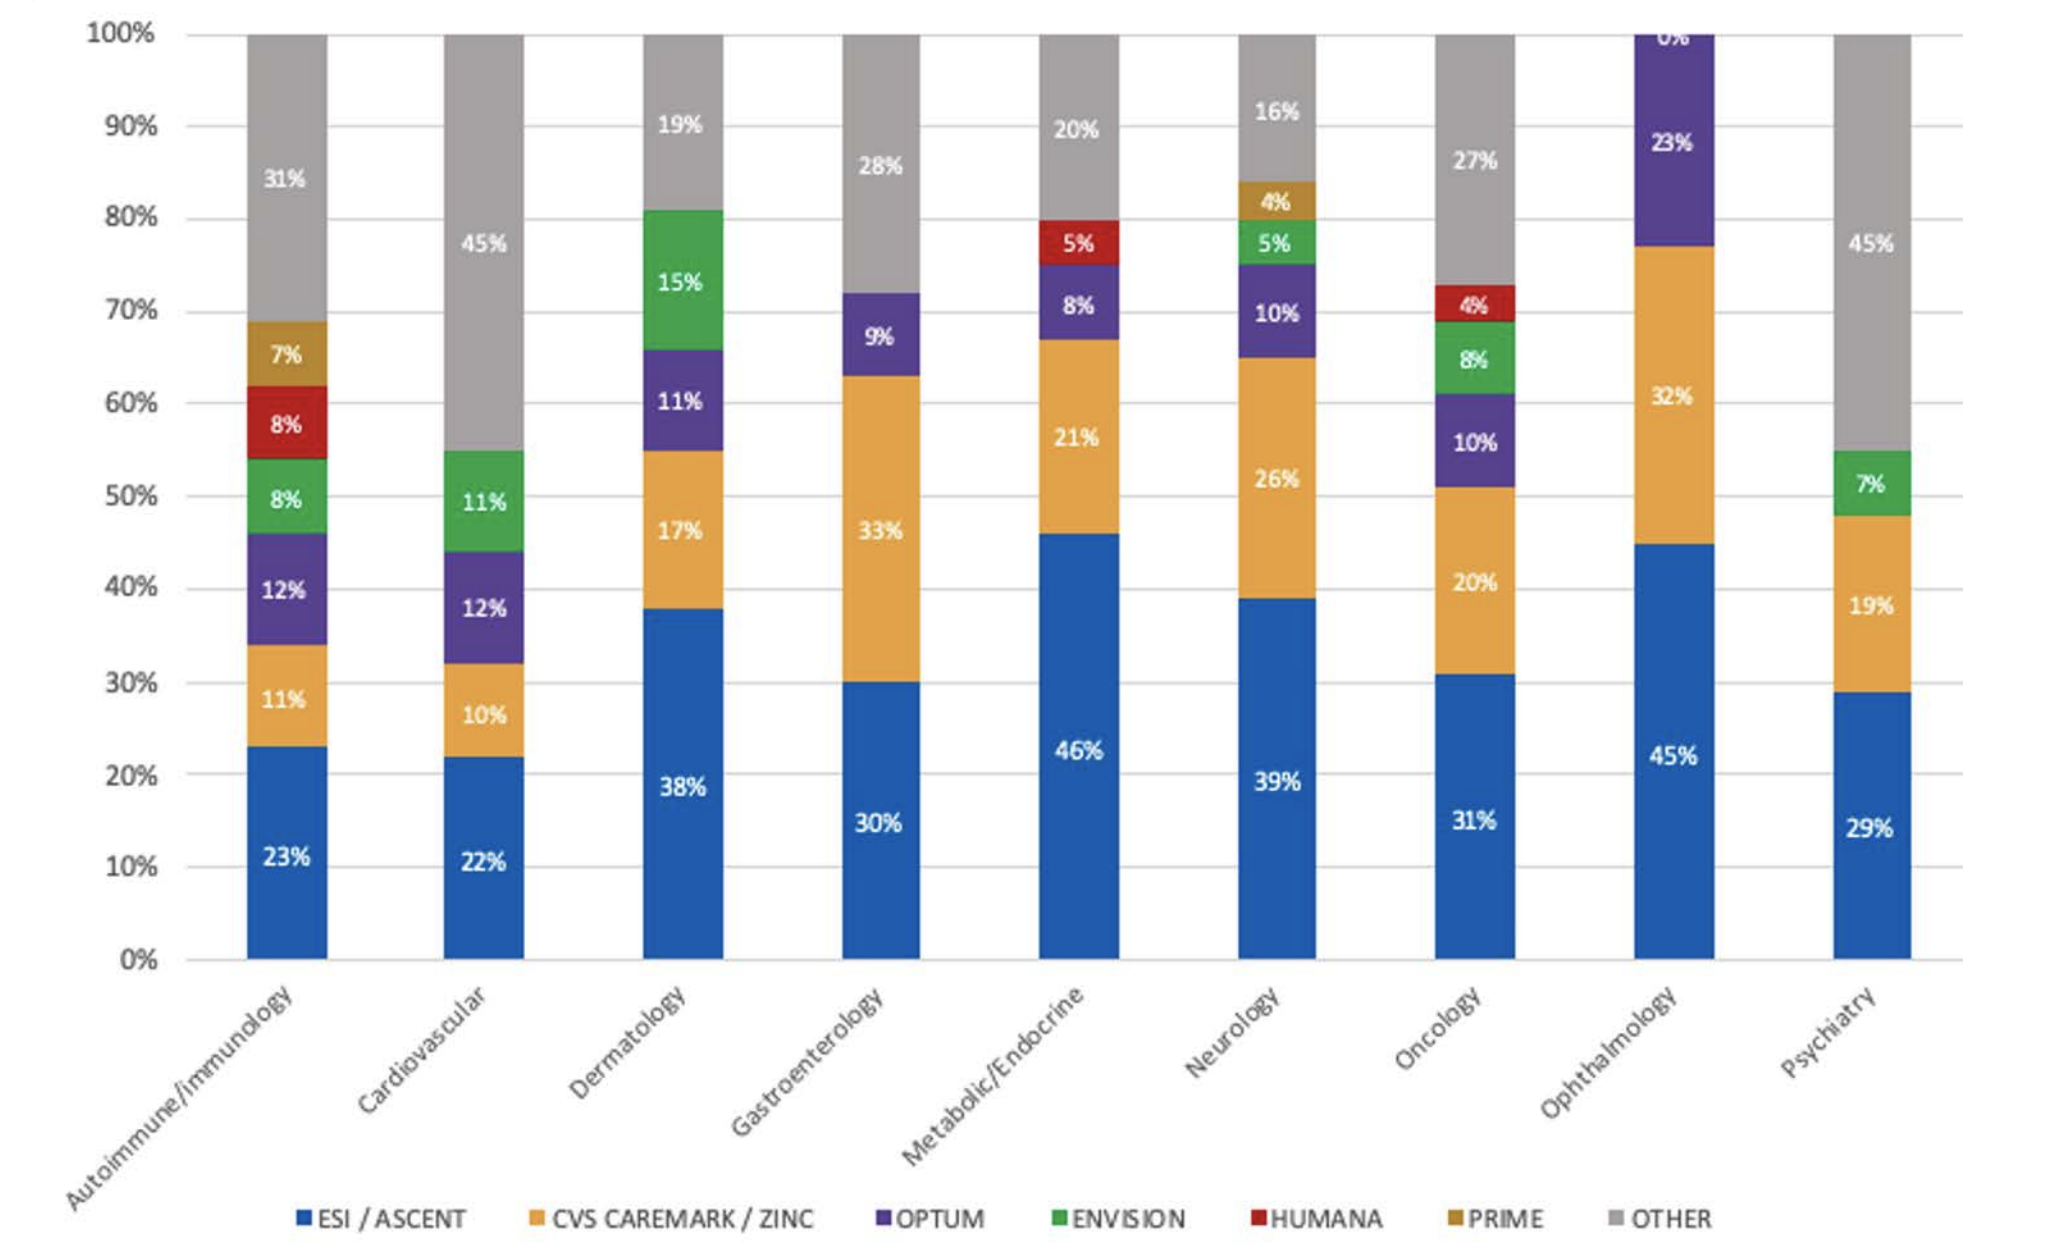
The next trend is a different slice of a similar data asset that highlights how some of the payer contracting decisions might change by therapeutic category. In the chart above, we can see what we would expect: contracting is still consolidated across all the major drug classes across the top three PBMs. But we also start to see some slight differences. In cardiovascular, for example, we might expect the product to be more commonly self-administered and see broader contracting with some of the smaller PBMs. By contrast, in neurology, which might be more traditionally physician-administered, we can see that the payer contracting is more consolidated.
It is important to acknowledge the reality of the disease-state class. The route of administration drives the realities of those contracts that are more focused directly on a PBM versus direct to a payer. The other thing to consider is the reality of the target patient population. For example, we can see that Humana tends to be a bit more Medicare Part D or Medicare Advantage focused than a payer more on the PBM side.
Product Launch Contracting Trends
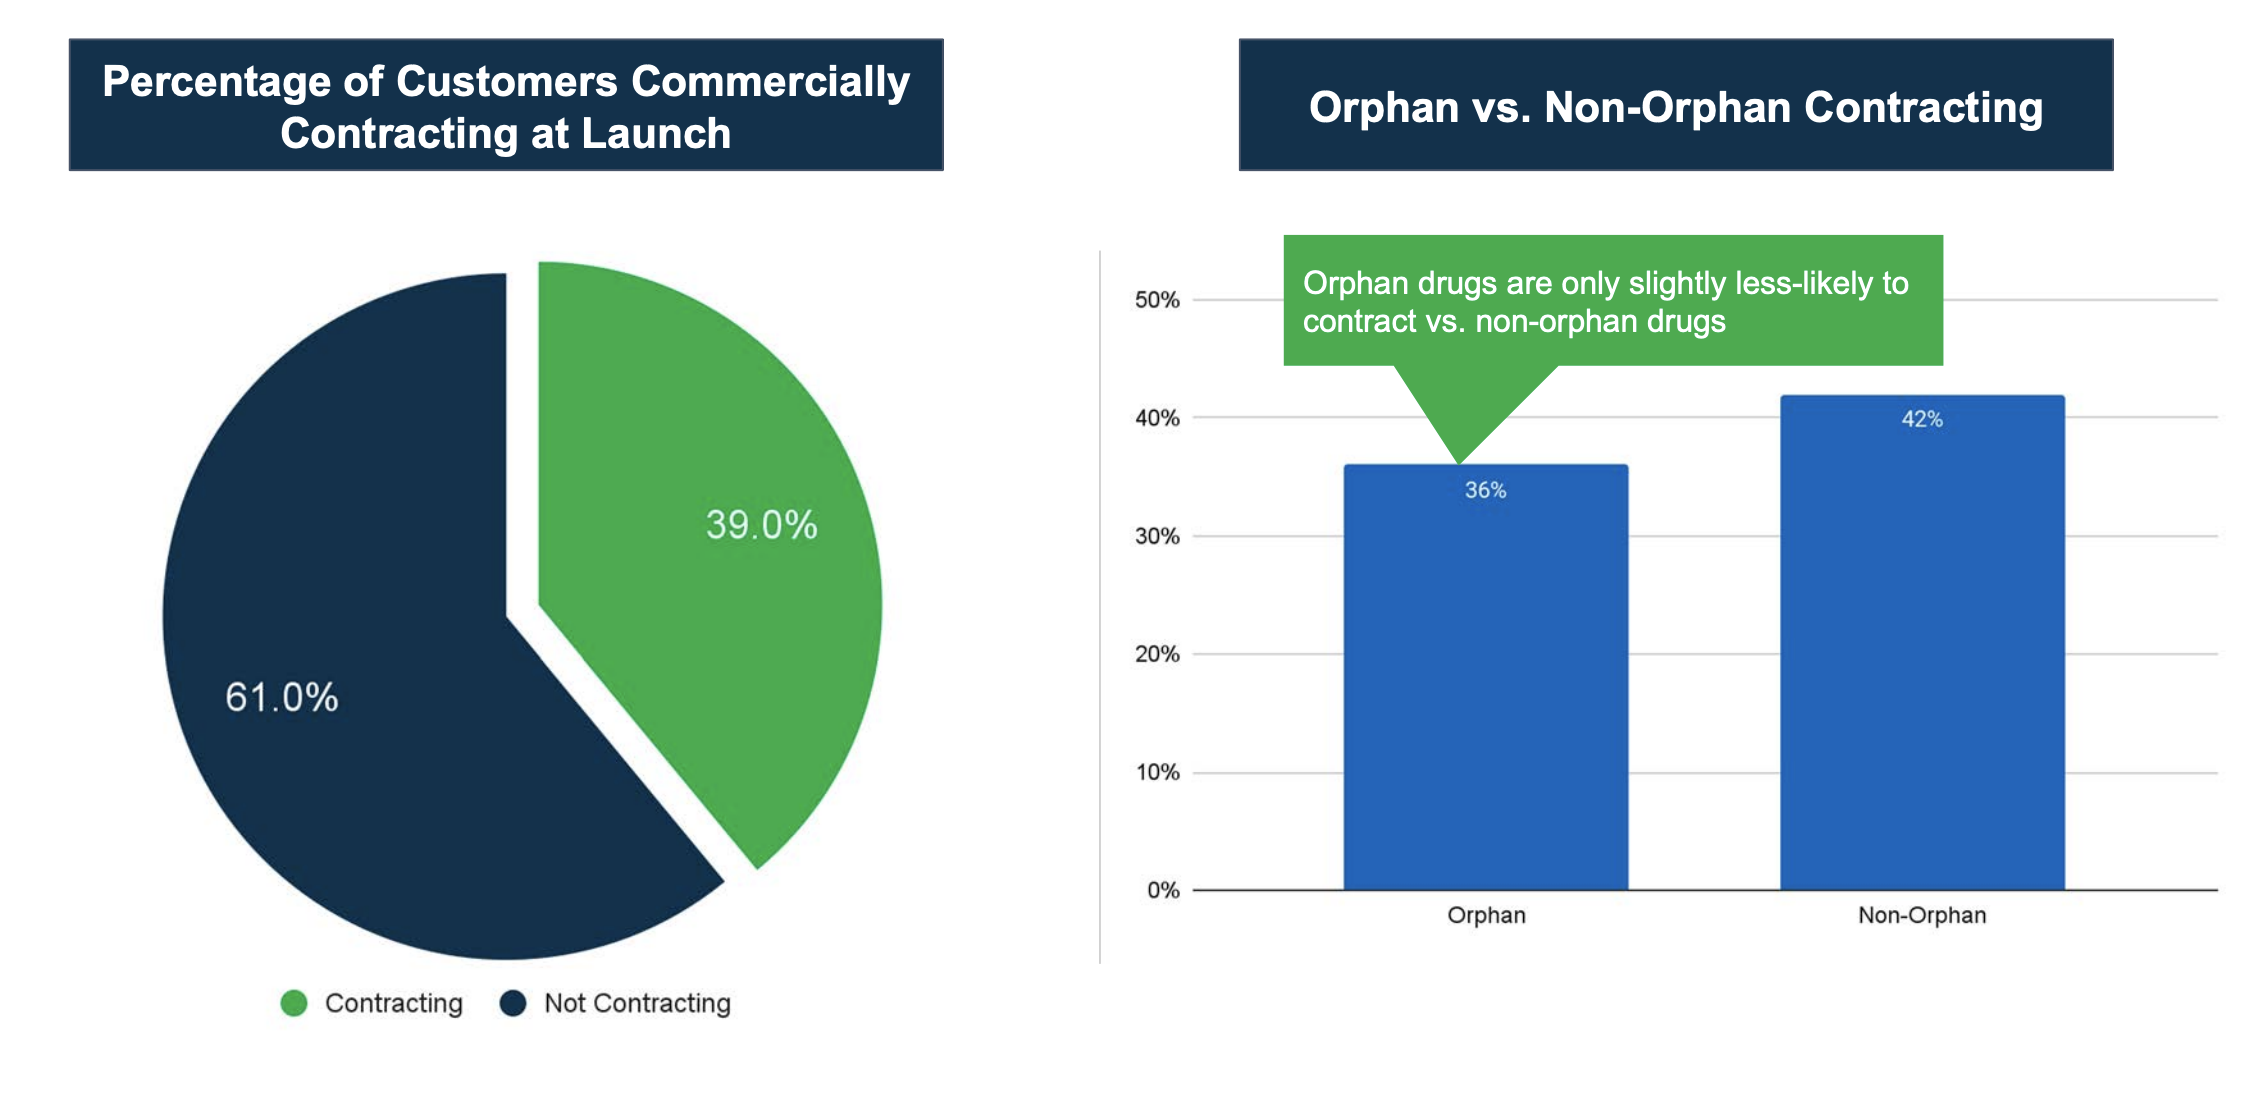
The next trend I want to highlight relates to the decision to contract at product launch, illustrated in the charts above for manufacturers that IntegriChain supported in their launch planning. About 39% of our customers planned to contract with commercial organizations at or near launch. The remaining 61% did not have contracts in place as part of their go-to-market strategy, but it is possible that some of them would start to plan for commercial contracting at some point in the future. When we think about what types of customers and brands are going to be engaging in contracting, we typically focus on traditional retail therapies. As we drill into this data and look at the bar chart on the right above, we see that more than a third of manufacturers were engaging in payer contracting at launch, which is an interesting development over the past couple of years.
When looking at contracting, manufacturers need to consider:
- What products are in your market basket and how are they being managed?
- What does their coverage look like from a competitive landscape?
The answers to these two questions might give you an idea of whether you need to contract or not, but the price of your product might also determine if you need to contract or not. The goal of the manufacturer to contract is to remove restrictions to access their product. The goal in this case of contracting is to meet that end by removing a barrier against yourself.
For rare and orphan disease therapies, considerations such as market basket are also in play. We typically begin with the clinical value proposition and how strong it is relative to competitors, and then we determine how that might stand up with the payers and the PBMs. Payer mix is definitely a key aspect as we think about launch, but there are other aspects to consider as well. You need to determine what appetite your organization has in terms of potential lag time, working through medical exceptions, working through appeals, and whether or not your leadership and organization are really comfortable with processes that take away friction and allow earlier patient uptake. Those are some examples of barriers can that payer or PBM can put in place. You need to determine if it’s worth it in terms of your gross-to-net.
More Trends and Implications
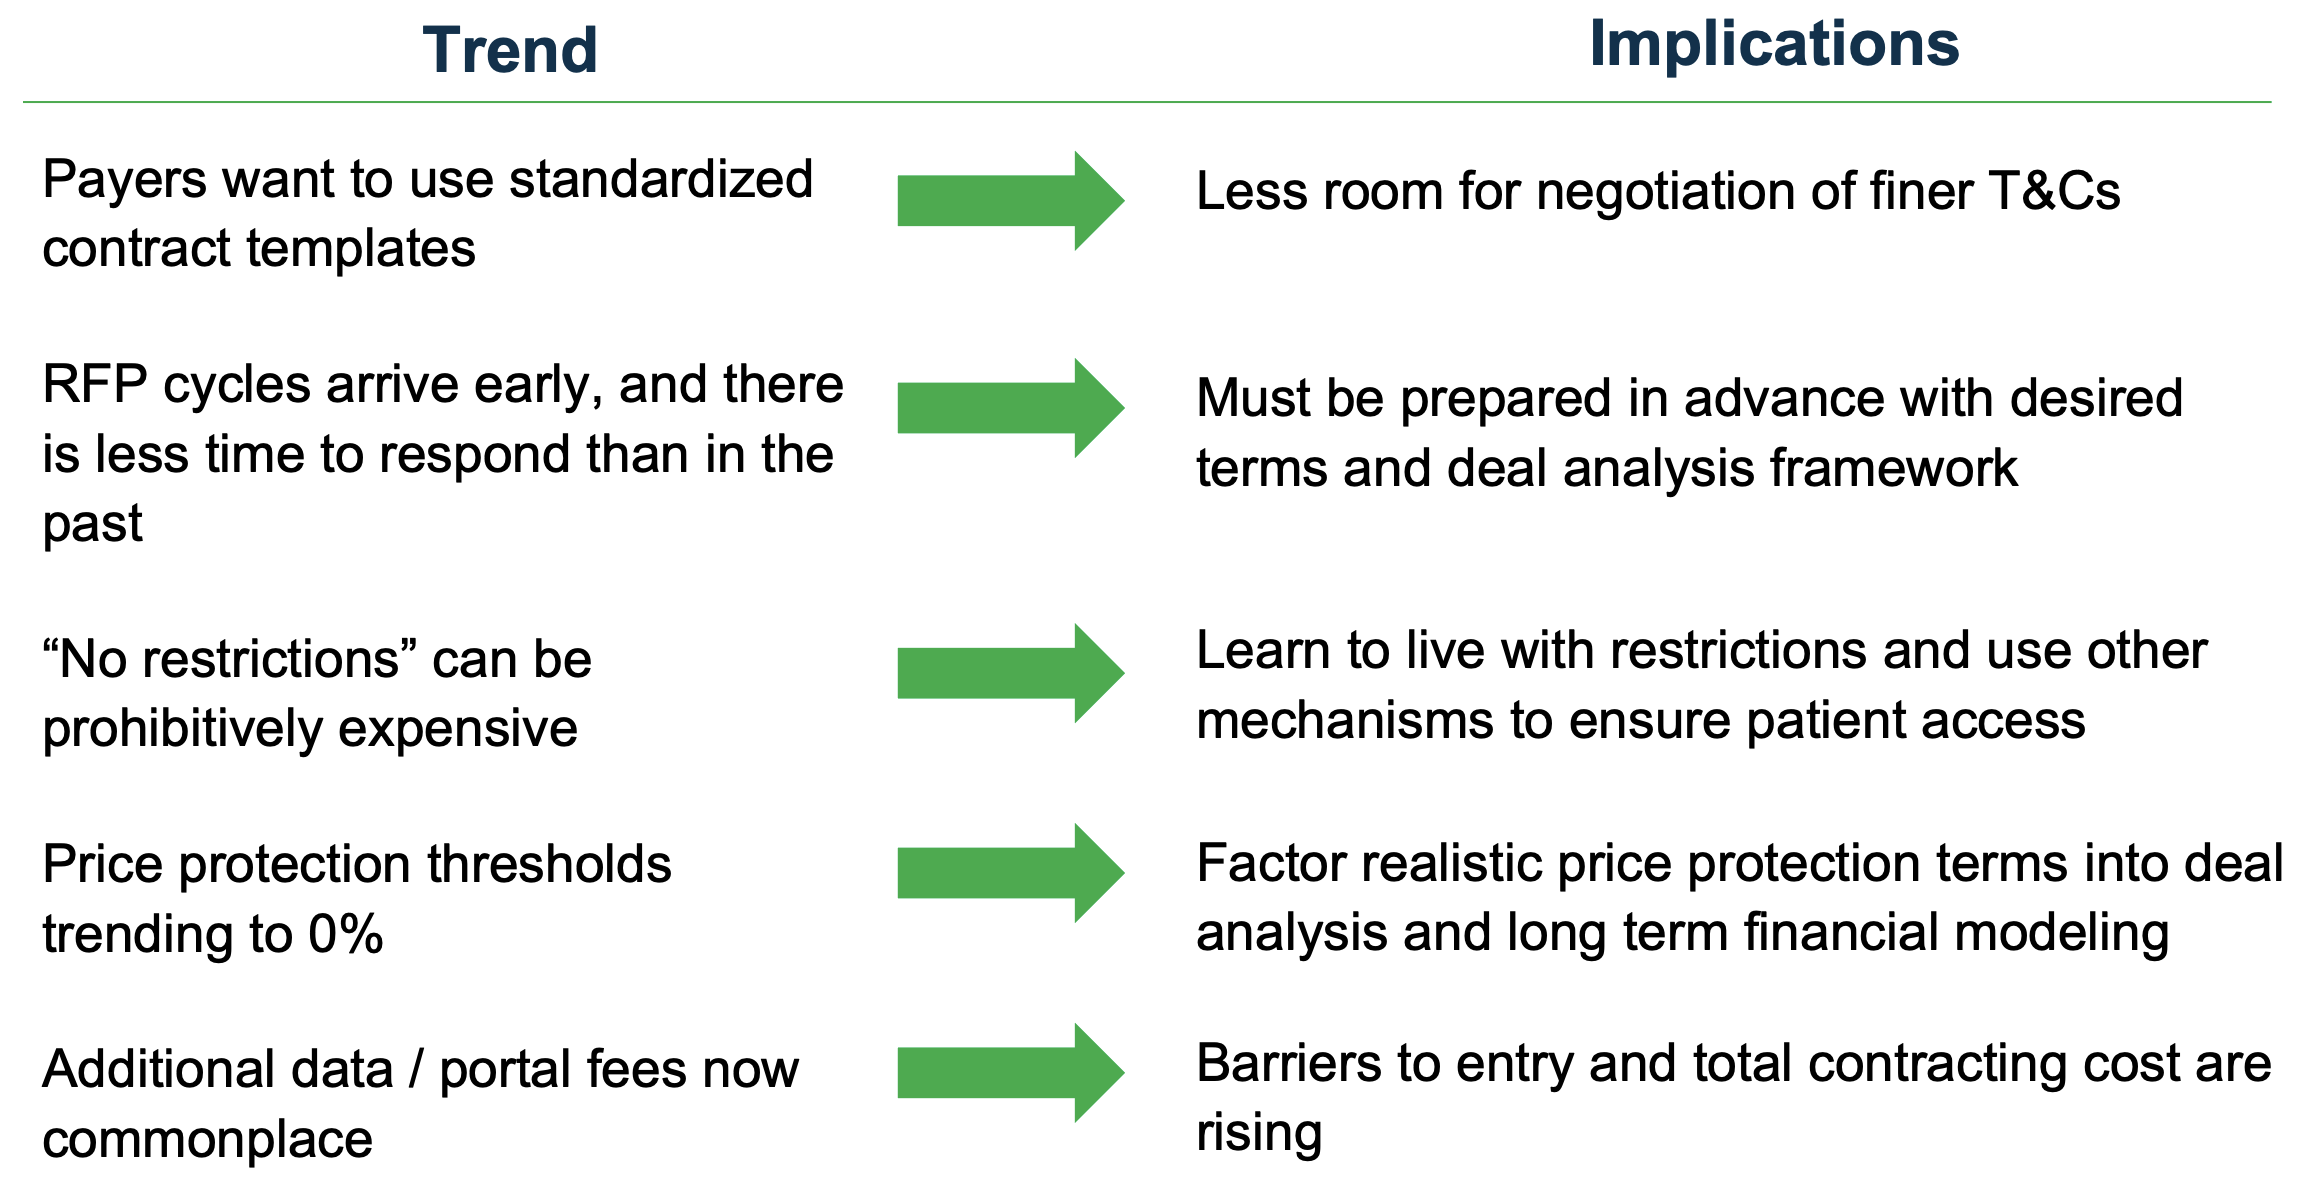
Above are some other trends and observations that are not necessarily based on our ICyte Benchmark data points but are more anecdotal and experiential.
Contract Standardization. As we’ve seen payers consolidate to the big three, we’ve seen them use more standardized contract templates. By moving to this model, we’re seeing very little room for the negotiation of some of the finer terms and conditions and less flexibility for adjusting some of the language.
Early RFP Cycles. As payers wield that contract control, we’re seeing RFP cycles arriving early and becoming shorter. Because of this, some manufacturers are caught off guard by not being able to do some of the proper due diligence and financial analysis in those short timeframes. So there is now a real need to be prepared ahead of time in advance for those RFPs.
“No Restrictions.” We’re also seeing the idea of “no restrictions” being prohibitively expensive and as a result, what you get out of contracting is perhaps not the same as it may have been a few years ago. Now the thought is to live with some restrictions but try to remove certain types to gain other value through the contracting process.
Pricing Protection Trending Downward. We’ve also seen price protection thresholds trending down for years now. Years back it was around 9%, before moving down to 6%. However, now we’re seeing several payers proposing with almost 0% thresholds as their starting point, which certainly impacts long-term pricing strategies.
Additional Fees. Most recently with the establishment of these GPOs is new gateway and data portal fees in the 1 to 2.5% range. These are on top of existing admin fees and as a result, are increasing the total cost of contract and barriers to entry.
How to Proactively Manage Contracting Implications
Our ICyte Benchmark data points and insights clearly show that the burdens are growing on part of the manufacturer. They can no longer expect that the payer or PBM will be coming to them with a contracting proposal that is in their best interest. For smaller organizations, they may not have the internal infrastructure in place to be able to support the evaluation of multiple contracting opportunities. They often need the help of a partner that could look across their current business and utilization and be able to project what the exposure would be across all payer segments and its impact on Best Price.
To make sure you’re not caught off guard, having partners like IntegriChain identified in advance of a product launch can help organizations mitigate risk, create relationships that help navigate these implications, and help forecast the realities of exposure on a contract now and in the future. Feel free to reach out. We’re here to help.
Learn more about accelerated contracting
About the Author

Jeff Baab
Jeff Baab leads IntegriChain’s Operational Consulting organization. Jeff has more than 16 years of experience in Managed Markets, drawing on his extensive compliance and commercial contracting background to best serve the needs of manufacturers. Previously, Jeff was Vice President of Life Sciences at daVIZta, which merged with IntegriChain in March 2019.